
User Manual Part 7
8-10 ApexPro™ 2001989-301A- draft 1
Viewing stored patient data
068A
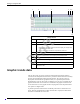
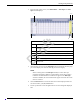
Graphic trends data
The CIC Pro center can retrieve parameter numeric data from patient monitors
connected to the Unity Network and retrieve parameter numeric data from secondary
devices connected through a Unity Network Interface. The CIC Pro center can
display this collected data in a graphical format, over a specified period of time.
Depending how your CIC Pro center is configured, you can view a maximum of six
graphic trends in half-screen mode and a maximum of 12 graphic trends in the full-
screen mode. You can view graphic trends in varying time scales and print them at a
laser printer or a digital writer.
A patient’s parameter numeric data is continually collected for a maximum of 24
hours. After the maximum hours of data collection have elapsed, the oldest data is
deleted to accommodate the newer data.
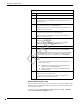
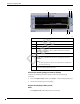
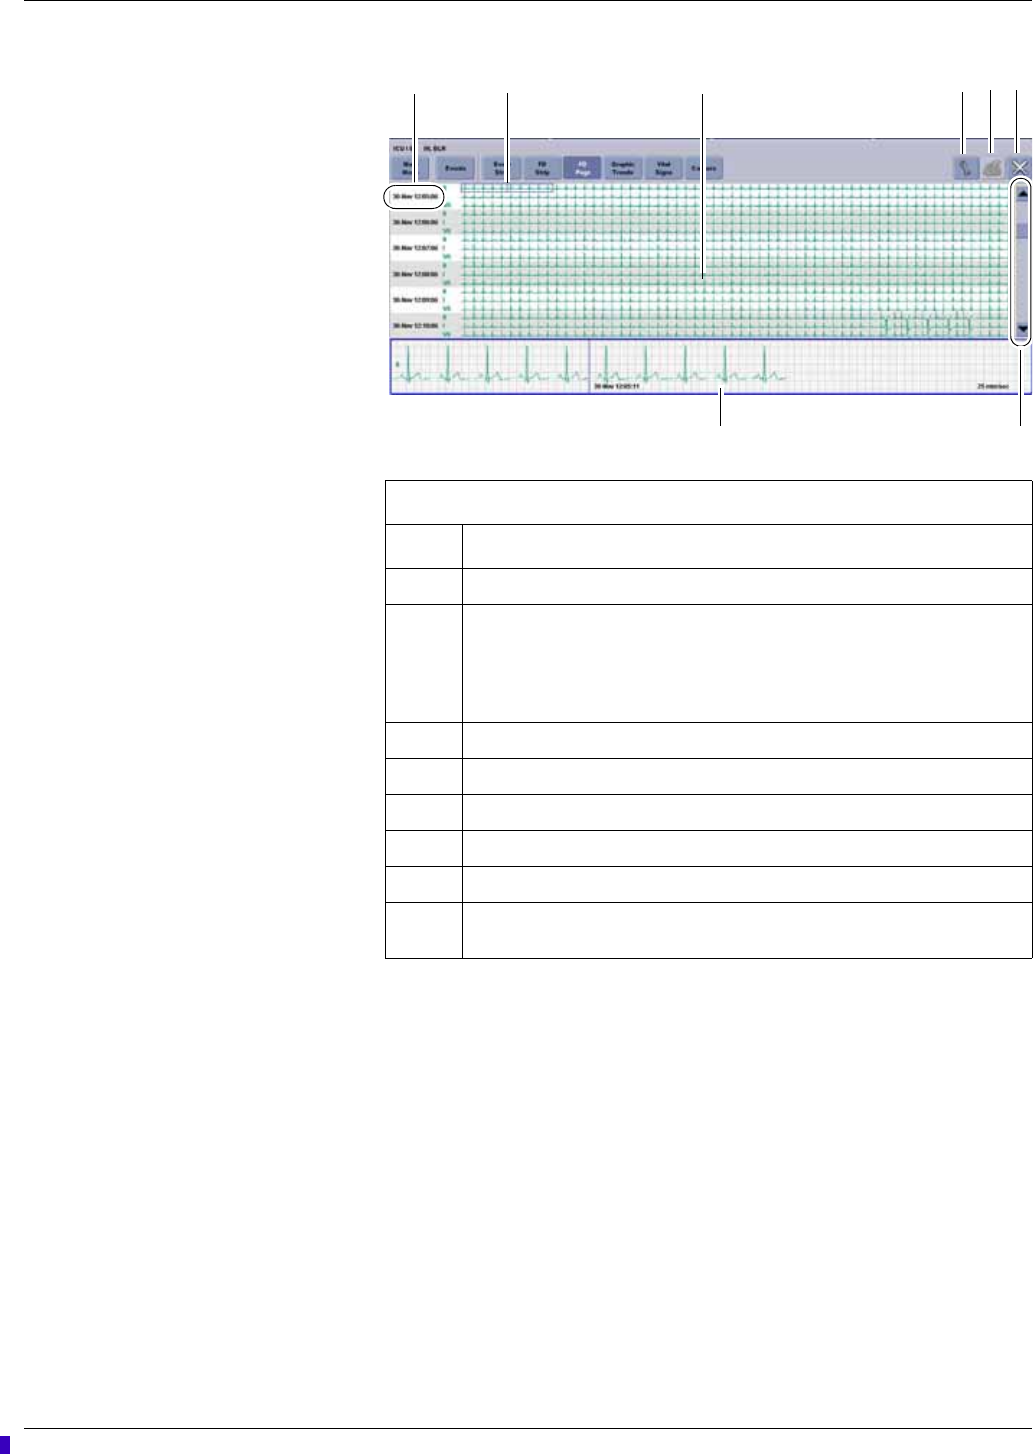
FD Page window
Item Description
1 Time and date stamp for this row of waveform data.
2 Zoom box.
Click inside the small blue-colored zoom box to display an enlarged view
of the selected waveform area.
Click on another area of interest to re-position the zoom box.
3 Waveform data.
4 Tools icon. Customize the on-screen display of full disclosure data.
5 Print icon. Customize and print a full disclosure report.
6 Close icon. Close the FD Page window.
7 Scroll bar. Display older or newer data.
8 Zoom Window. View the enlarged waveform selected in the small blue-
colored zoom box.
1
2
3 4
5 6
78
Draft