
User manual


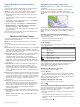


Table Of Contents
- Table of Contents
- Introduction
- Customizing the Chartplotter
- Home Screen
- Customizing Pages
- Presets
- Setting the Vessel Type
- Adjusting the Backlight
- Adjusting the Color Mode
- Turning On the Chartplotter Automatically
- Enabling Screen Lock
- Automatically Turning Off the System
- ActiveCaptain App
- Communication with Wireless Devices
- Charts and 3D Chart Views
- Navigation Chart and Fishing Chart
- Premium Charts
- Automatic Identification System
- Chart Menu
- Supported Maps
- Garmin Quickdraw Contours Mapping
- Mapping a Body of Water Using the Garmin Quickdraw Contours Feature
- Adding a Label to a Garmin Quickdraw Contours Map
- Garmin Quickdraw Community
- Garmin Quickdraw Contours Settings
- Navigation with a Chartplotter
- Basic Navigation Questions
- Destinations
- Waypoints
- Marking Your Present Location as a Waypoint
- Creating a Waypoint at a Different Location
- Marking an SOS Location
- Projecting a Waypoint
- Viewing a List of all Waypoints
- Editing a Saved Waypoint
- Moving a Saved Waypoint
- Browsing for and Navigating to a Saved Waypoint
- Deleting a Waypoint or an MOB
- Deleting All Waypoints
- Routes
- Creating and Navigating a Route From Your Present Location
- Creating and Saving a Route
- Viewing a List of Routes and Auto Guidance Paths
- Editing a Saved Route
- Browsing for and Navigating a Saved Route
- Browsing for and Navigating Parallel to a Saved Route
- Initiating a Search Pattern
- Deleting a Saved Route
- Deleting All Saved Routes
- Auto Guidance
- Tracks
- Showing Tracks
- Setting the Color of the Active Track
- Saving the Active Track
- Viewing a List of Saved Tracks
- Editing a Saved Track
- Saving a Track as a Route
- Browsing for and Navigating a Recorded Track
- Deleting a Saved Track
- Deleting All Saved Tracks
- Retracing the Active Track
- Clearing the Active Track
- Managing the Track Log Memory During Recording
- Configuring the Recording Interval of the Track Log
- Boundaries
- Deleting All Saved Waypoints, Tracks, Routes, and Boundaries
- Sailing Features
- Sonar Fishfinder
- Stopping the Transmission of Sonar Signals
- Changing the Sonar View
- Traditional Sonar View
- Garmin ClearVü Sonar View
- SideVü Sonar View
- Panoptix Sonar Views
- Selecting the Transducer Type
- Selecting a Sonar Source
- Creating a Waypoint on the Sonar Screen
- Pausing the Sonar Display
- Viewing Sonar History
- Sonar Sharing
- Adjusting the Level of Detail
- Adjusting the Color Intensity
- Sonar Recordings
- Traditional, Garmin ClearVü, and SideVü Sonar Setup
- Setting the Zoom Level on the Sonar Screen
- Setting the Scroll Speed
- Adjusting the Range of the Depth or Width Scale
- Sonar Noise Rejection Settings
- Sonar Appearance Settings
- Sonar Alarms
- Advanced Sonar Settings
- Traditional, Garmin ClearVü, and SideVü Transducer Installation Settings
- Sonar Frequencies
- Turning On the A-Scope
- Panoptix Sonar Setup
- Zooming in a Panoptix LiveVü or LiveScope Sonar View
- Adjusting the RealVü Viewing Angle and Zoom Level
- Adjusting the RealVü Sweep Speed
- LiveVü Forward and FrontVü Sonar Menu
- LiveVü and FrontVü Appearance Settings
- RealVü Appearance Settings
- LiveScope and Perspective Sonar Menu
- LiveScope and Perspective Sonar Setup
- LiveScope and Perspective Appearance Settings
- Panoptix Transducer Installation Settings
- Radar
- Radar Interpretation
- Transmitting Radar Signals
- Adjusting the Radar Range
- MotionScope™ Doppler Radar Technology
- Enabling a Guard Zone
- MARPA
- Echo Trails
- Radar Settings
- Selecting a Different Radar Source
- Changing the Radar Mode
- Autopilot
- Force® Trolling Motor Control
- Digital Selective Calling
- Gauges and Graphs
- inReach® Messages
- Digital Switching
- Dometic® Optimus® Features
- Tide, Current, and Celestial Information
- Warning Manager
- Media Player
- Opening the Media Player
- Selecting the Media Device and Source
- Playing Music
- Adjusting the Volume
- VHF Radio
- Radio
- DAB Playback
- SiriusXM Satellite Radio
- Setting the Device Name
- Updating the Media Player Software
- SiriusXM Weather
- SiriusXM Equipment and Subscription Requirements
- Weather Data Broadcasts
- Weather Warnings and Weather Bulletins
- Changing the Weather Chart
- Viewing Precipitation Information
- Forecast Information
- Viewing Fish Mapping Data
- Viewing Sea Conditions
- Viewing Sea Temperature Information
- Visibility Information
- Viewing Buoy Reports
- Weather Overlay
- Viewing Weather Subscription Information
- Viewing Video
- Selecting a Video Source
- Networked Video Devices
- Configuring the Video Appearance
- Garmin VIRB® Action Cameras
- HDMI Out Video Considerations
- Pairing the GC™ 100 Camera with a Garmin Chartplotter
- Device Configuration
- Sharing and Managing User Data
- Appendix
- Index

3
Select Information.
Viewing Details about Navaids
From the Navigation chart, Fishing chart, Perspective 3D chart
view, or Mariner’s Eye 3D chart view, you can view details about
various types of navigation aids, including beacons, lights, and
obstructions.
NOTE: The Fishing chart is available with premium charts, in
some areas.
NOTE: 3D chart views are available with premium charts, in
some areas.
1
From a chart or 3D chart view, select a navaid.
2
Select the name of the navaid.
Navigating to a Point on the Chart
WARNING
All route and navigation lines displayed on the chartplotter are
only intended to provide general route guidance or to identify
proper channels, and are not intended to be precisely followed.
Always defer to the navaids and conditions on the water when
navigating to avoid groundings or hazards that could result in
vessel damage, personal injury, or death.
The Auto Guidance feature is based on electronic chart
information. That data does not ensure obstacle and bottom
clearance. Carefully compare the course to all visual sightings,
and avoid any land, shallow water, or other obstacles that may
be in your path.
When using Go To, a direct course and a corrected course may
pass over land or shallow water. Use visual sightings, and steer
to avoid land, shallow water, and other dangerous objects.
NOTE: The Fishing chart is available with premium charts, in
some areas.
NOTE: Auto Guidance is available with premium charts, in some
areas.
1
From the Navigation chart or Fishing chart, select a location.
2
If necessary, select Navigate To.
3
Select an option:
• To navigate directly to the location, select Go To or .
• To create a route to the location, including turns, select
Route To or .
• To use Auto Guidance, select Auto Guidance or .
4
Review the course indicated by the magenta line.
NOTE: When using Auto Guidance, a gray segment within
any part of the magenta line indicates that Auto Guidance
cannot calculate part of the Auto Guidance line. This is due to
the settings for minimum safe water depth and minimum safe
obstacle height.
5
Follow the magenta line, steering to avoid land, shallow
water, and other obstacles.
Premium Charts
WARNING
All route and navigation lines displayed on the chartplotter are
only intended to provide general route guidance or to identify
proper channels, and are not intended to be precisely followed.
Always defer to the navaids and conditions on the water when
navigating to avoid groundings or hazards that could result in
vessel damage, personal injury, or death.
The Auto Guidance feature is based on electronic chart
information. That data does not ensure obstacle and bottom
clearance. Carefully compare the course to all visual sightings,
and avoid any land, shallow water, or other obstacles that may
be in your path.
NOTE: Not all models support all charts.
Optional premium charts, such as BlueChart
®
g3 Vision, allow
you to get the most out of your chartplotter. In addition to
detailed marine charting, premium charts may contain these
features, which are available in some areas.
Mariner’s Eye 3D: Provides a view from above and behind the
boat for a three-dimensional navigation aid.
Fish Eye 3D: Provides an underwater, three-dimensional view
that visually represents the sea floor according to the
information on the chart.
Fishing Charts: Shows the chart with enhanced bottom
contours and without navigational data. This chart works well
for offshore deep-sea fishing.
High Resolution Satellite Imagery: Provides high-resolution
satellite images for a realistic view of the land and water on
the Navigation chart (Showing Satellite Imagery on the
Navigation Chart, page 11).
Aerial Photos: Shows marinas and other navigationally
significant aerial photos to help you visualize your
surroundings (Viewing Aerial Photos of Landmarks,
page 11).
Detailed Roads and POI data: Shows detailed road and point
of interest (POI) data, which includes highly detailed coastal
roads and POIs such as restaurants, lodging, and local
attractions.
Auto Guidance: Uses specified information about your vessel
and chart data to determine the best path to your destination.
Fish Eye 3D Chart View
Using the depth contour lines of the premium charts, such as
BlueChart g3 Vision, the Fish Eye 3D chart view provides an
underwater view of the sea floor or lake bottom.
Suspended targets, such as fish, are indicated by red, green,
and yellow spheres. Red indicates the largest targets and green
indicates the smallest.
Viewing Tide Station Information
The icon on the chart indicates a tide station. You can view a
detailed graph for a tide station to help predict the tide level at
different times or on different days.
NOTE: This feature is available with premium charts, in some
areas.
1
From the Navigation chart or Fishing chart, select a tide
station.
Tide direction and tide level information appear near .
2
Select the station name.
Animated Tide and Current Indicators
NOTE: This feature is available with premium charts, in some
areas.
You can view indicators for animated tide station and current
direction on the Navigation chart or the Fishing chart. You must
also enable animated icons in the chart settings (Showing Tides
and Current Indicators, page 11).
An indicator for a tide station appears on the chart as a vertical
bar graph with an arrow. A red arrow pointing downward
indicates a falling tide, and a blue arrow pointing upward
indicates a rising tide. When you move the cursor over the tide
10 Charts and 3D Chart Views