
User Guide


Garmin G1000 Pilot’s Guide for the Mooney M20M/M20R/M20TN
190-00647-00 Rev. A6-18
HAZARD AVOIDANCE
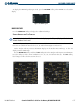
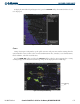
Figure 6-22 36-Hour Surface Analysis Data
Figure 6-23 48-Hour Surface Analysis Data
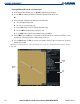
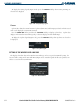
To display the Surface Analysis (Figure 6-24) and City Forecast legend, press the LEGEND Softkey when
Surface Analysis and City Forecast are selected to be displayed.
Figure 6-24 Surface Analysis Legend
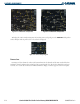
FREEZING LEVEL
Freezing Level data shows the color-coded contour lines for the altitude and location at which the first
isotherm is found. When no data is displayed for a given altitude, the data for that altitude has not been
received, or is out of date and has been removed from the display. New data appears at the next update.