
User Guide


Garmin G1000 Pilot’s Guide for the Cessna Citation Mustang
190-00494-00 Rev. B3-4
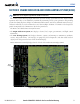
EICAS
EIS information is presented using horizontal and vertical bar indicators and digital readouts. Green ranges on
the instrument scales indicate normal ranges of operation; yellow and red bands indicate caution and warning,
respectively. During normal operating conditions, an instrument’s pointer appears in white or green and readout
text is green. Refer to each instrument description for additional details on display behavior.
When an unsafe operating condition occurs, the pointer and readout color change to indicate a caution (yellow)
or warning (red). If the time limit for an unsafe condition is exceeded, the color of the sliders, pointers, and
digits may change to denote an increase in priority level, even if the parameter is still within in the lower priority
condition range. If sensor data for a parameter becomes invalid or unavailable, a red “X” is displayed across the
indicator and/or readout.
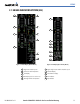
Figure 3-5 Indicators and Exceedance Levels
Pointer
(Exceedance)
Normal Band
Exceedance
Levels
Pointer
(Normal)
Slider
(Exceedance)
Exceedance
Levels
Slide
(Normal)
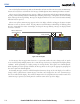
ENGINE STAGE ROTATION SPEEDS (N1 AND N2)
The N1 display (Figure 3-6) indicates the engine fan rotation speeds while the N2 (Figure 3-7) readouts show
the engine high pressure turbine rotation speeds. Both are shown as percentages. The N1 and N2 displays are
shown in the same format in reversionary mode.
The N1 display ranges from 20 to 110% of maximum rotational speed. Values and limits are obtained from
the Full Authority Digital Engine Controller (FADEC). An N1 target is shown for each engine by a bug along
the scale. The readout in the box at the top of the scale is the minimum N1 target value for both engines. If N1
drops below 20%, the sliders are removed from the scale while the readouts remain displayed below.
When the N1 values of the engines are synchronized, ‘SYNC’ appears in green between the readouts below
the scale. The FADEC controls three mutually-exclusive thrust modes; the corresponding indication appears in
green above the N1 scale according to Table 3-1.
Indication Thrust Mode
CRU
Cruise
CLB Max Climb
T/O Takeoff
Table 3-1 Thrust Modes
Figure 3-6 N1 Display
N1 Target
Value
N1 Target Bug
Warning
Line
Thrust Mode
N1 Values
Synchronized
The N2 readouts are located beneath the ITT display. At engine start, the readouts appear in white. Once
normal operating conditions are reached, the readouts change to green.
Figure 3-7 N2 Display