
User manual


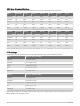
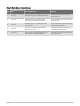
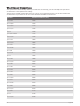

Table Of Contents
- Table of Contents
- Introduction
- Training
- My Stats
- Performance Measurements
- Training Status Levels
- About VO2 Max. Estimates
- Training Load
- Training Load Focus
- Viewing Cycling Ability
- About Training Effect
- Recovery Time
- Getting Your FTP Estimate
- Viewing Your Real-Time Stamina
- Viewing Your Stress Score
- Turning Off Performance Notifications
- Viewing Your Power Curve
- Pausing Your Training Status
- Personal Records
- Training Zones
- Performance Measurements
- Navigation
- Locations
- Courses
- Map Settings
- Route Settings
- Connected Features
- Pairing Your Phone
- Bluetooth Connected Features
- Safety and Tracking Features
- Incident Detection
- Assistance
- Adding Emergency Contacts
- Viewing Your Emergency Contacts
- Requesting Assistance
- Turning Incident Detection On and Off
- Cancelling an Automated Message
- Sending a Status Update After an Incident
- Turning On LiveTrack
- Starting a GroupTrack Session
- Setting the Bike Alarm
- Playing Audio Prompts on Your Phone
- Safety and Tracking Features
- Wi‑Fi Connected Features
- Wireless Sensors
- History
- Customizing Your Device
- Connect IQ Downloadable Features
- Profiles
- About Training Settings
- Phone Settings
- System Settings
- Setting Up Extended Display Mode
- Device Information
- Troubleshooting
- Appendix

VO2 Max. Standard Ratings
These tables include standardized classifications for VO2 max. estimates by age and gender.
Males Percentile 20–29 30–39 40–49 50–59 60–69 70–79
Superior 95 55.4 54 52.5 48.9 45.7 42.1
Excellent 80 51.1 48.3 46.4 43.4 39.5 36.7
Good 60 45.4 44 42.4 39.2 35.5 32.3
Fair 40 41.7 40.5 38.5 35.6 32.3 29.4
Poor 0–40 <41.7 <40.5 <38.5 <35.6 <32.3 <29.4
Females Percentile 20–29 30–39 40–49 50–59 60–69 70–79
Superior 95 49.6 47.4 45.3 41.1 37.8 36.7
Excellent 80 43.9 42.4 39.7 36.7 33 30.9
Good 60 39.5 37.8 36.3 33 30 28.1
Fair 40 36.1 34.4 33 30.1 27.5 25.9
Poor 0–40 <36.1 <34.4 <33 <30.1 <27.5 <25.9
Data reprinted with permission from The Cooper Institute. For more information, go to www.CooperInstitute.org.
FTP Ratings
These tables include classifications for functional threshold power (FTP) estimates by gender.
Males Watts per Kilogram (W/kg)
Superior 5.05 and greater
Excellent From 3.93 to 5.04
Good From 2.79 to 3.92
Fair From 2.23 to 2.78
Untrained Less than 2.23
Females Watts per Kilogram (W/kg)
Superior 4.30 and greater
Excellent From 3.33 to 4.29
Good From 2.36 to 3.32
Fair From 1.90 to 2.35
Untrained Less than 1.90
FTP ratings are based on research by Hunter Allen and Andrew Coggan, PhD, Training and Racing with a Power
Meter (Boulder, CO: VeloPress, 2010).
90 Appendix