
User Manual


XScopes
User’s Manual
DS-XScopes-3.5 – December, 2014 Page | 20
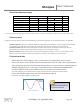
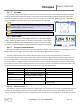
2.4.3 Spectrum Analyzer
The spectrum analyzer is done by calculating the Fast Fourier Transform (FFT)
of the selected analog channels (or the channel math functions if enabled). When
the FFT is enabled, the spectrum is plotted as frequency vs. magnitude. The
horizontal axis represents the frequency (Hertz), and the vertical axis represents
the magnitude. Figure 36 shows the XScope in Spectrum Analyzer Mode. The
Nyquist frequency is shown on the top right corner of the display.
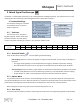
2.4.3.1 IQ FFT Mode
When the IQ FFT is disabled, the XScope calculates two independent 256 point FFTs of the analog channels, the Real
and Imaginary components of the FFT have the same data. The output of the FFT is symmetrical, but only half of the result
is shown on the display. When the IQ FFT is enabled, only one FFT is calculated, the Real component is filled with the CH1
data, and the Imaginary component is filled with the CH2 data. The result is a 256 point FFT, you can use the horizontal
controls described in section 2.1.3 to explore all the data (since only 128 points can be shown on the display). The IQ FFT is
useful to monitor RF Spectrums with the proper hardware mixer.
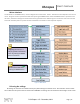
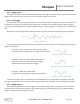
2.4.3.2 Logarithm display
The log is useful when analyzing low level components on the signal. When analyzing audio, it is also very useful as it
maps more directly to how humans perceive sound. The actual function performed is: y = 16 * log
2
(x).
Example:
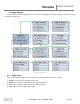
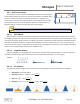
2.4.3.3 FFT Windows
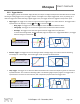
To reduce the spectral leakage, an FFT window function can be applied. Four FFT window types are available:
Rectangular: No window applied
Hamming:
Hann:
Blackman:
Figure 40: Window and sine frequency response, from left to right: Rectangular, Hamming, Hann and Blackman
Figure 36: Spectrum Analyzer Mode
Figure 37: Triangle Wave
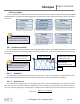
Figure 39: FFT without Log
Figure 38: FFT with Log
If only interested in one channel, turn off the other channel to maximize the vertical display.