
Owner manual
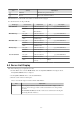

Icon Tool tip Explanation
Maximize Maximizes the specified window
Restore Restores the maximized window
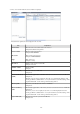
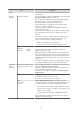
The table below shows the CSV file items if data is downloaded from each graph.
Note that the CSV file encoding is Shift-JIS.
Graph type Column name Explanation Unit Description
CPU utilization
date_time Collection start time yyyy-mm-dd HH:mm:ss
Nickname VM host Nickname
value
CPU utilization
%
Disk R/W usage
date_time Collection start time yyyy-mm-dd HH:mm:ss
Nickname VM host Nickname
value Disk R/W usage Mbytes
Disk R/W count
date_time Collection start time yyyy-mm-dd HH:mm:ss
Nickname VM host Nickname
value
Disk R/W count
Memory usage
date_time Collection start time yyyy-mm-dd HH:mm:ss
Nickname VM host Nickname
value Memory usage Mbytes
Network utilization
date_time Collection start time yyyy-mm-dd HH:mm:ss
Nickname VM host Nickname
value
Network usage (sent and
received)
Mbytes
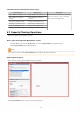
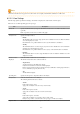
5.4 Server List Display
Perform the following steps to display the server list:
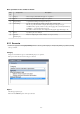
1. From the ROR console, select the Dashboard tab, then select System Conditions in the displayed sub tab.
The System Conditions window is displayed.
2. In the System Conditions window, select the Server List tab.
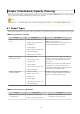
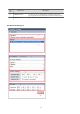
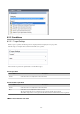
3. Enter the search conditions in the left pane.
Select or enter the following item, and then click the Search button.
Item Explanation
Tenant In the displayed tenant list, select the checkbox of the tenant to display. Use the
browser's "find on this page" feature to find a tenant when there are a large number
of tenants.
The Select/Deselect All button checkbox can be used to switch between selecting and
deselecting all tenant checkboxes.
- 39 -