
Owner manual
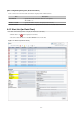

Item Explanation
Configuration Information Display" for the displayed configuration information.
The following display names are displayed in accordance with the CI type:
- For the tenant CI type: The tenant name determined during tenant registration
("tenant name (tenant ID)")
- For the L-Platform CI type: The L-Platform subscription name set during L-
Platform subscription
- For the L-Server CI type: The L-Server name set during L-Platform subscription
or L-Platform reconfiguration ("server name (host name)")
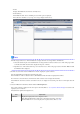
CI Type This column displays the configuration item type.
The CI type displayed depends on the element selected in the tree at the left.
The CI types are as follows:
- Tenant: If a tenant is selected
- L-Platform: If an L-Platform is selected
- L-Server: If an L-Server is selected
Note
Clicking the CI list column headers to sort the columns is effective only for the range displayed in that page. The sorting specification is
reset when the next or previous page is displayed. Sorting spanning multiple pages is not available.
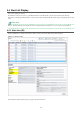
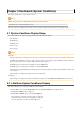
5.2.1 System Conditions Display
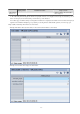
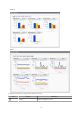
The system conditions of the L-Platforms selected in the system conditions window CI list is displayed as a graph at System Conditions
in the lower part of the window. Up to five L-Servers can be displayed at once in the graphs. If more than five L-Servers are selected, the
first five are displayed.
The system conditions contents can be switched by clicking the System Conditions tabs.
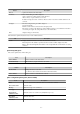
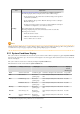
The table below shows the contents under the System Conditions tabs.
Tab name Display content (*1) Graph type Display interval Display
interval
switching (*2)
Total Totals for each status Vertical bar graph 30 minutes, starting from the current time Not possible
CPU CPU utilization Horizontal
polyline graph
One hour/day/month/year from the current
time
Possible
Disk Disk R/W usage (*3) Horizontal
polyline graph
One hour/day/month/year from the current
time
Possible
Disk R/W count (*4) Horizontal
polyline graph
One hour/day/month/year from the current
time
Possible
Memory Memory usage (*5) Horizontal
polyline graph
One hour/day/month/year from the current
time
Possible
Network Network usage (*6) Horizontal
polyline graph
One hour/day/month/year from the current
time
Possible
All Overview of all the above
statuses
Horizontal
polyline graph
One hour/day/month/year from the current
time
Possible
*1: Information is displayed using a different color for each L-Server.
- 26 -