
iCommand-Touch Manual


CAP-837
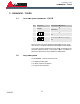
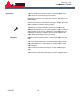
Menu" screen
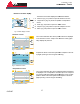
Fig. 16: "Code input" screen
The "Menu" button allows access to the menu system. All setting p
rameter are located here.
Representation of the graphics
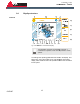
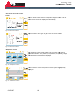
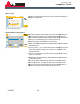
Fig. 17: "Pressure" screen
The measured values for the pressure and the final compressor te
perature are saved regularly. The collected data is graphically di
played. Within the graph surface the display area can be zoomed into
by pulling on the rectangle using your fingers (Zoom i
The following option are available in the x direction:
Max: All available data point
adjusted for this.
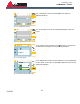
10 min, 30 min, 1 h: The respective section is displayed. Using the
arrow keys allows scrolling in the x d
selected interval.
X
Manually: This option allows to select date and time and set them
to the desired value.
The y
parameter
changed. Input is done via a keypad. Tap the double arrow at the y
axis and the limits are reset to the values from the men
iCommand
20
The "Menu" button allows access to the menu system. All setting p
rameter are located here.
The measured values for the pressure and the final compressor te
perature are saved regularly. The collected data is graphically di
played. Within the graph surface the display area can be zoomed into
by pulling on the rectangle using your fingers (Zoom i
n).
The following option are available in the x direction:
Max: All available data point
s
are displayed. Both axes are ideally
adjusted for this.
10 min, 30 min, 1 h: The respective section is displayed. Using the
arrow keys allows scrolling in the x d
irection by a quarter of the
selected interval.
X
-Auto: The values from the menu
Display parameter
X-Auto assumed.
Manually: This option allows to select date and time and set them
to the desired value.
The y
-
axis is initially scaled with the values from the menu
parameter
Graphs
. The upper as well as the lower limit can be
changed. Input is done via a keypad. Tap the double arrow at the y
axis and the limits are reset to the values from the men
u.
iCommand – Touch
iCommand
- Touch
The "Menu" button allows access to the menu system. All setting p
a-
The measured values for the pressure and the final compressor te
m-
perature are saved regularly. The collected data is graphically di
s-
played. Within the graph surface the display area can be zoomed into
n).
are displayed. Both axes are ideally
10 min, 30 min, 1 h: The respective section is displayed. Using the
irection by a quarter of the
Display parameter
Graphs
Manually: This option allows to select date and time and set them
axis is initially scaled with the values from the menu
Display
. The upper as well as the lower limit can be
changed. Input is done via a keypad. Tap the double arrow at the y
-
u.