
Product Info
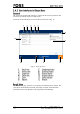
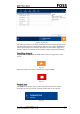
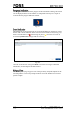
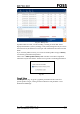
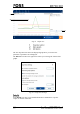

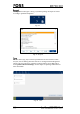

Table Of Contents
- 1 Safety
- 2 Introduction
- 3 Installation
- 4 Operating Instructions
- 4.1 Start-up
- 4.2 Analysis Procedure
- 4.3 Care - Default Features
- 4.4 Care View - Advanced Settings
- 4.4.1 Instrument Diagnostics
- 4.4.2 Advanced Diagnostics
- 4.4.3 Instrument Information
- 4.4.4 User Manual
- 4.4.5 FossConnect Synchronisation
- 4.4.6 Settings
- 4.4.7 Local Configurator
- 4.4.8 Data Maintenance
- 4.4.9 Instrument Calibration
- 4.4.10 Remote Support
- 4.4.11 Export Logs
- 4.4.12 Change PIN Code
- 4.4.13 Manual Sample Transfer
- 4.4.14 Lamp Change
- 4.4.15 Automate Sample Transfer
- 4.4.16 Help
- 4.5 Check Samples
- 4.6 Instrument Calibration
- 5 Maintenance
- 6 Troubleshooting
- 7 Parts, Accessories and Consumables
- 8 Technical Specifications

Fig. 23 The information tab in Details view
All registrations linked to the sample by the user:
• Sample number
• Sample comments
• User-Defined Fields
Information about how and when the sample was analysed:
• Product
• Sample cup
• Operation profile
• Date and time
Display of results and outliers.
Warnings and errors are indicated with yellow and red backgrounds.
Predictions per subsample, including min, max and standard deviation.
Graphical display of the absorbance spectrum (raw data).
Subsample spectra are displayed only if Operation Profile in FossManager is
configured to store subsample spectra.
The Audit Trail lists all relevant information on how the sample was analysed. It
gives the user a traceable record of the circumstances under which the results were
obtained.
Examples:
• Which prediction model and which version were used?
• What cup type and which operation profile were used?
• Was any Slope/Intercept applied?
• Which limits were used for outlier detection?