
User Guide

Multiple Master Fonts
603
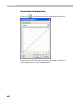
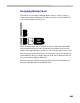
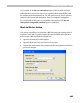
The X-axis on the graph represents the X interpolation position on the
design axis. The Y-axis represents the relative Y interpolation. Here are
some examples of the possible X-Y interpolation relationships:
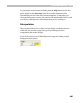
Isotropic, proportional interpolation. This is the
default setting.
Fixed Y (width) axis. Width does not change when
you move the slider. The weight (X axis) changes
linearly along the weight axis.
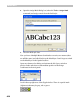
To edit the graph, use same mouse commands as when you are editing a
glyph’s outline. Right+Left click inserts a point. Right click when a point is
being moved removes the point.
Click on the
button to reset any changes and return the graph to the
linear state.