
User Guide

Multiple Master Fonts
593
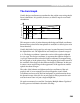
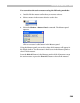
The Axis Graph
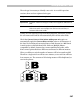
Usually design coordinates are translated to the weight vector using simple
linear calculations. It is possible, however, to define a map for non-linear
calculations:
Design coordinates
6
0.0
1.0
72
Bl
e
n
dcoo
r
d
in
ates
This map sets a series of points that map the design and blend coordinates.
Between these points linear interpolation is used (this is called a piece-wise
linear function).
Usually this kind of axis graph (or axis map, in some literature) is used for
the Optical Size axis. The Optical Size axis usually has a dynamic range of
6-72. The design coordinate 6 means the version of the typeface adjusted
for 6 pt. type. The design coordinate 72 represents the typeface design for
72 pt. type. Between these values the blend coordinates are mapped using
the axis graph, as in the picture above. This mapping gives better control of
the variation of the design for the different design coordinates. In this case
it causes a more rapid change in the appearance of the typeface at smaller
optical sizes than at larger.
The value of the leftmost and rightmost design coordinates of the axis
graph (6 and 72 in our example) are always mapped to 0 and 1 blend
coordinates and are used by the font interpreter to get information about
the dynamic range of the axis. So an axis graph is always present for each
axis but in most cases it is just a single straight line.
We again recommend you read the “Designing Multiple Master Typefaces”
book to get more information about the axis map.