
Users Manual Owner manual


Versiv Cabling Certification Product Family
Technical Reference Handbook
104
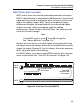
from the other pairs. The tester uses the PS NEXT and attenuation
values to calculate PS ACR-N values.
PS ACR-N results are typically a few dB lower (worse) than worst-
case ACR-N results. Figure 50 shows the PS ACR-N plot. The tester
puts the cursor at the worst margin.
Note
If the PS ACR-N result is an an , the 4 dB rule
applies. See “About dB Rules” on page 116.
GPU106.PNG
Figure 50. PS ACR-N Plot