
User manual


DMM Operation
Graph the Measurements 5
5-3
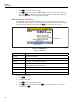
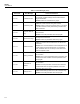
4. Make a measurement from the front panel. After the measurement is stable, push
(REL) to set the baseline.
5. Observe subsequent readings as relative measurements.
Relative Measurement Value
Baseline Measurement
Releative Function Softkey
hcn047.eps
Figure 5-3. Relative Measurement
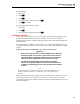
Graph the Measurements
The DMM has a graph feature that lets the user display the measurement data in a graph.
The graph has features such as History mode and Live mode to let the user evaluate the
data on the display. The graph automatically scales to fit all the information on the
display when opened. To refine the data, the graph can be manipulated with the arrow
keys as shown in Figure 5-4.
Range
Time Stamps
History or
Live Mode
Toggle Grid
Graph Controls
(Front-Panel Keys)
Zoom Out
Zoom In
Move Right (in History Mode)
Move Left (in History Mode)
Manually change the Scale
hcn048.eps
Figure 5-4. Graph Function
To see the measurement data in a graph:
1. Push
.
2. Configure the input.