
User's Guide
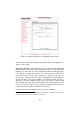
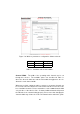
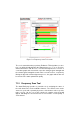
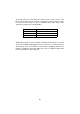
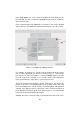
Table Of Contents

As shown in Fig. 7.9, each bar in the chart consists of two sections. The
black section represents the amount of interference detected in the chan-
nel, whereas the colored one gives a qualitative idea of the status of the
channel according to the following table:
Color Channel Quality
GREEN GOOD
YELLOW FAIR
RED BAD
Additional information such as number of Fluidmesh units and access points
detected is available by bringing the cursor of the mouse over the frequency
channel bars. Please note that in a network with overlapping channels, the
number of Fluidmesh units detected by the scan tool might be higher than
the actual number of units deployed.
46