
User's Manual
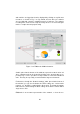
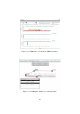
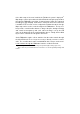
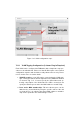
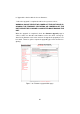
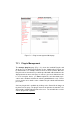
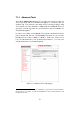
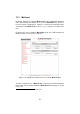
Table Of Contents

and statistics are logged and can be displayed by clicking on any link met-
ric button, as shown in Fig. 7.13. By default, the last 48 hour’s statistics
are recorded with a metrics’ sampling interval of 5 minutes. The statistics
recording time can be increased up to 24 days at the cost of increasing the
metrics’s sample interval proportionally.
Figure 7.12: FMQuadro. Link information.
A table, placed at the bottom of the window, reports the network units’ ad-
dress summary and can be viewed by clicking on the proper button as re-
ported in Fig. 7.14. It is possible to assign a name to each of the Fluidmesh
units. This may be especially convenient with a large mesh network.
Furthermore, through the “Network Settings” table, placed at the bottom of
the window, you can check whether the DFS settings are consistent the
network, e.g., the DFS is enabled in the all the units. The Network Settings
table allows for harmonizing the DFS settings in the whole network with a
single mouse click.
FMQuadro is an accurate representation of the network, so it can be use-
50