
User's Manual
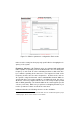
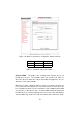
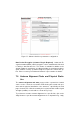
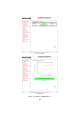
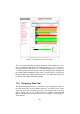
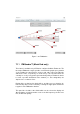
Table Of Contents

In the graph, blue is the color of a mesh end whereas mesh points are de-
picted in red. The unit color becomes yellow if any anomalous condition is
detected on the unit.
Each element displayed in FMQuadro is interactive, and can be dragged
and/or clicked to get additional real-time information based on the context.
Figure 7.11: FMQuadro. Unit information.
For example, by clicking on a specific unit, information about the remote
unit selected is displayed in a callout as shown in Fig. 7.11. This informa-
tion includes the Layer 2 IP address, current FluidMAX status of the unit,
the radio frequencies currently in use, and the details of the data traffic
flows generated by the edge devices connected to the unit.
The list of currently active Plug-ins is visible. Furthermore, any Plug-in Ac-
tivation Code can be conveniently added to the specific remote unit using
the form available in the callout. Finally, current throughput and maximum
capacity of the Ethernet port is reported in order to monitor the Ethernet
ports utilization and detect whether the Ethernet port is over-utilized with
respect to the installed FluidThrottle Plug-in.
Similarly, the status of a wireless link connecting any two units can be mon-
48