
User's Manual

29
Ethernet ports utilization and detect whether the Ethernet port is over utilized with respect to the
installed FluidThrottle Plug-in.
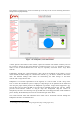
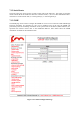
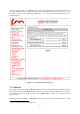
Similarly, the status of a wireless link connecting any two units can be monitored by clicking on
the related line, as reported in Figure 7.12. Several real-time parameters are displayed including
the current signal strength, the packet error rate, and the link utilization of both link directions (i.e.
the link from a unit to the other and vice-versa). Additionally, the current congestion level of the
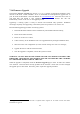
link is monitored. A detailed description of the available parameters is reported in Table 7.4.
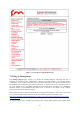
Visual alarms and warnings are triggered whenever anomalous conditions are detected, as
described in Table 7.4. Warnings are of two types: link and unit. When unit warnings are
triggered, the unit color becomes yellow. The warning details are available by clicking on the
unit element. The link warnings notification can be disabled by removing the “Warning” flag in the
FMQuadro top panel.
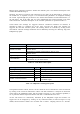
Metric!
Description!
]6))*&$!RY!Z2$*!
]6))*&$!0%& 1!$)2&+-%++%#&!)2 $*!%& !;3/+U!
.2(1*$!>))#)!Z2$*!
.*)(*&$2'*!#9!@2(1*$!8)#@@*8!86*!$#!*^(*++%T*!$)2&+<!
-%++%#&!*))#)+U!
A%&1!>))#)!Z2$*!
.*)(*&$2'*! #9! @2(1*$! )*$)2 &+ - %++%#& +! 86*! $#! $)2&+<!
-%++%#&!*))#)+U!
?%'&20!?$)*&'$S!
]6))*&$!)*( *%T* 8!+%'&20!0*T*0!%&!8"- U!
A%&1!W$%0%G2$%#&!
.*)(*&$2'*!! #9!! $S*!! (6))*&$!! 0%&1!! 6$%0%G2$%#&!! 9#)!! 82$2!
$)2&+-%++%#& !%& !2!@%*!(S2)$!9#)- 2$U!
Table 7.4: Link Metrics Description.
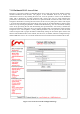
Warning!
Type!
Cause!
A#4!?%'&20!?$)*&'$S!
A%&1!
A%&1!?%'&20!?$)*&'$S!_!NM`U!
F%'S!>))#)!Z2$*!
A%&1!
.2(1*$!>))#)!Z2$*!a!E`U!
F%'S!A%&1!]#&'*+$%#&!
A%&1!
A%&1!W$%0%G2$%#&!a!JM`U!
>$S*)&*$!]2@2(%$,!XT*)90#4!
W&%$!
.06'<%&!(2@2(%$,!*^(**8*8U!
F%88*&!R*)-%&20![*$*($*8!
W&%$!
F%88*&!! $*)-%&20!! 8*$*($*8!! 3,!! $S* !
506%8;=Y!*&'%&*U!
Table 7.5: FMQuadro Warning Description
Through the link status callout, the user can also check the level of interference of the selected link
by clicking on the “Check for Interference” button. The link interference is analyzed on both sides
of the link by the FMQuadro engine and the interface suggests, in case of detected problems, a
set of preferred channel frequencies that the radio link is recommended to be set to.
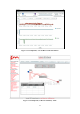
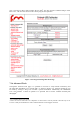
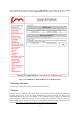
All the link metrics are continuously monitored by the FMQuadro engine and statistics are
logged and can be displayed by clicking on any link metric button, as shown in Figure 7.13. By
default, the last 48 hour’s statistics are recorded with a metrics’ sampling interval of 5 minutes.