
User's Manual


28
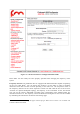
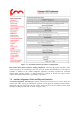
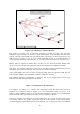
Figure 7.10: FMQuadro™ (Mesh End Only)
This feature is available only in FM units configured in Mesh End mode. The innovative
FMQuadro engine provides an interactive graph representation of the Fluidmesh network where
vertices and edges represent FM units and wireless links, respectively, as shown in Figure 7.10. The
links which are currently in use by every packet generated/ relayed by a Fluidmesh device to
reach a possible destination in the network (i.e., the routing table) are depicted as continuous lines.
Backup links are depicted as dashed lines, and they are not shown by de-fault. Backup links
can be viewed by selecting the appropriate field in the top panel of the FMQuadro window.
This panel also includes other fields which can be selected to display additional always-on link
information such as the link frequency, the link error rate, and the link quality.
In the graph, blue is the color of a mesh end whereas mesh points are depicted in red. The unit
color becomes yellow if any anomalous condition is detected on the unit.
Each element displayed in FMQuadro is interactive, and can be dragged and/or clicked to get
additional real-time information based on the context.
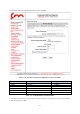
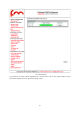
Figure 7.11: FMQuadro, Unit Information
For example, by clicking on a specific unit, information about the remote unit selected is
displayed in a callout as shown in Figure 7.11. This information includes the Layer 2 IP
address, current FluidMAX status of the unit, the radio frequencies currently in use, and the details
of the data traffic flows generated by the edge devices connected to the unit.
The list of currently active Plug-ins is visible. Furthermore, any Plug-in Activation Code can be
conveniently added to the specific remote unit using the form available in the callout. Finally,
current throughput and maximum capacity of the Ethernet port is reported in order to monitor the