
User's Manual

32
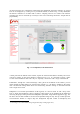
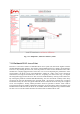
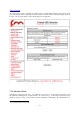
All the link metrics are continuously monitored by the FMQuadro engine and statistics are logged
and can be displayed by clicking on any link metric button, as shown in Fig. 7.14. By default, the
last 48 hour’s statistics are recorded with a metrics’ sampling interval of 5 minutes. The statistics
recording time can be increased up to 24 days at the cost of increasing the metrics’ sample interval
proportionally.
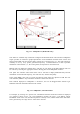
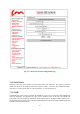
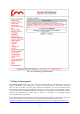
Fig. 7.13 - FMQuadro, Link Information
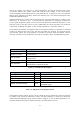
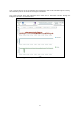
A table, placed at the bottom of the window, reports the network units address summary and can be
viewed by clicking on the proper button as reported in Fig. 7.15. It is possible to assign a name
to each of the Fluidmesh units. This may be especially convenient with a large mesh network.
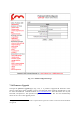
Furthermore, through the “Network Settings” table, placed at the bottom of the window, you can
check whether the DFS settings are consistent the network, e.g., the DFS is enabled in the all the
units. The Network Settings table allows for harmonizing the DFS settings in the whole network
with a single mouse click.
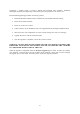
FMQuadro is an accurate representation of the network, so it can be useful to add a map of the
area in which the Fluidmesh system is deployed
6
. Map images can be uploaded to the Mesh End
unit using the proper button placed in the FMQuadro top toolbar. Image format supported is jpg. The
file has to be less than 100 KB in size and can be uploaded using IE only. The top toolbar provides
several intuitive buttons to drag & drop the background map and control its transparency and
6
Aerial images can be downloaded using Google Earth (http://earth.google.com/).