
User's Manual

31
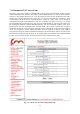
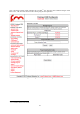
Metric!
Description!
Current!TX!Rate!
Current!link !transmission!rate!in !Mb/s.!
Packet!Error!Rate!
Percentage!of!packet!dropped!due!to!excessive!tra ns@!
mission!errors.!
Link!Error!Rate!
Percentage! of! packet! retran sm issio ns! due! to! tra ns@!
mission!errors.!
Signal!Strength!
Current!rece ived!signal!level !in!dBm.!
Link!Utilization!
Percentage! of!the!current!! link!! utilization!! for!! data!
transmission !in !a!pie!chart!format.!
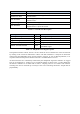
Table 7.4 - Link Metrics Description
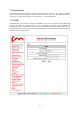
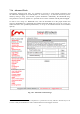
Warning!
Type!
Cause!
Low!Signal!Strength!
Link!
Link!Signal!Strength!<!60%.!
High!Error!Rate!
Link!
Packet!Error!Rate!> !5%.!
High!Link!Congestion!
Link!
Link!Utilization!>!80%.!
Ethernet!Capacity!Overflow!
Unit!
Plug@in!capacity!exceeded.!
Hidden!Terminal!Detected!
Unit!
Hidden!terminal!!d etected!! by!! the!
FluidMAX!engine.!
Table 7.5 - FMQuadro Warning Description
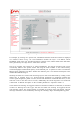
Through the link status callout, the user can also check the level of interference of the selected link
by clicking on the “Check for Interference” button. The link interference is analyzed on both sides
of the link by the FMQuadro engine and the interface suggests, in case of detected problems, a set
of preferred channel frequencies that the radio link is recommended to be set to.
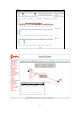
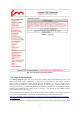
All the link metrics are continuously monitored by the FMQuadro engine and statistics are logged
and can be displayed by clicking on any link metric button, as shown in Fig. 7.14. By default, the
last 48 hour’s statistics are recorded with a metrics’ sampling interval of 5 minutes. The statistics
recording time can be increased up to 24 days at the cost of increasing the metrics’ sample interval
proportionally.