
User's Manual

30
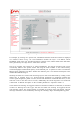
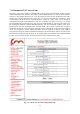
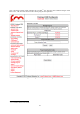
Fig. 7.12 - FMQuadro, Unit Information
For example, by clicking on a specific unit, information about the remote unit selected is displayed
in a callout as shown in Fig. 7.12. This information includes the Layer 2 IP address, current
FluidMAX status of the unit, the radio frequencies currently in use, and the details of the data traffic
flows generated by the edge devices connected to the unit.
The list of currently active Plug-ins is visible. Furthermore, any Plug-in Activation Code can be
conveniently added to the specific remote unit using the form available in the callout. Finally,
current throughput and maximum capacity of the Ethernet port is reported in order to monitor the
Ethernet ports utilization and detect whether the Ethernet port is over utilized with respect to the
installed FluidThrottle Plug-in.
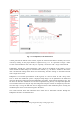
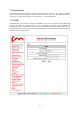
Similarly, the status of a wireless link connecting any two units can be monitored by clicking on the
related line, as reported in Fig. 7.13. Several real-time parameters are displayed including the
current signal strength, the packet error rate, and the link utilization of both link directions (i.e. the
link from a unit to the other and vice-versa). Additionally, the current congestion level of the link
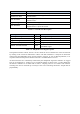
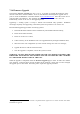
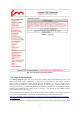
is monitored. A detailed description of the available parameters is reported in Table 7.4.
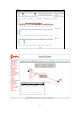
Visual alarms and warnings are triggered whenever anomalous conditions are detected, as described
in Table 7.4. Warnings are of two types: link and unit. When unit warnings are triggered, the unit
color becomes yellow. The warning details are available by clicking on the unit element. The link
warnings notification can be disabled by removing the “Warning” flag in the FMQuadro top panel.