
User's Manual

24
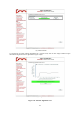
The user is warned that the proprietary Fluidmesh TPC algorithm (see Section 7.8) will be
disabled during the alignment process so as to avoid unwanted interactions with the tools. The
antenna alignment tool consists of a real-time graph and a bar which report the average signal
strength and the current signal strength detected at the local unit receiver, respectively. During the
physical antenna alignment process, the graph and the bar can be monitored to obtain optimal link
quality.
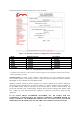
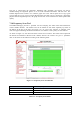
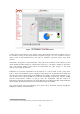
7.10 Frequency Scan Tool
The Scan Tool page provides a powerful tool for analyzing the status of the radio interference
in the available channels. The channel scan can be started on each radio separately by means of
the buttons at the top of the page (see Figure 7.9). As soon as the scanning is complete, a bar
chart will appear indicating the current interference level and the overall quality of each channel.
As shown in Figure 7.9, each bar in the chart consists of two sections. The black section represents
the amount of interference detected in the channel, whereas the colored one gives a qualitative
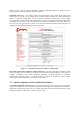
idea of the status of the channel according to the following table:
Figure 7.9: Frequency Scan Tool Results.
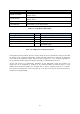
Color!
Channel,Quality!
7[@@G!
7PP\!
]@RRPY!
5HQ[!
[@\!
"H\!
Table 7.3: Frequency Scan Status