
Installation Instructions
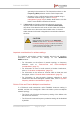
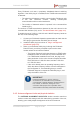
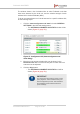
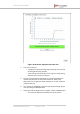
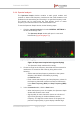
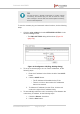
Table Of Contents
- Fluidmesh 4200 FIBER
- Table of Contents
- 1. HAZARDOUS CONDITION WARNINGS
- 2. Reporting mistakes and recommending improvements
- 3. Getting Started
- 4. Hardware installation
- 4.1. Fluidmesh Hardware Installation
- 4.2. Connecting the Fluidmesh Fluidmesh 4200 FIBER to a network and antennas
- 5. Using the Fluidmesh Partner Portal
- 6. Device configuration using the configurator interface
- 6.1. Software and hardware prerequisites
- 6.2. Accessing the Fluidmesh 4200 FIBER for device configuration
- 6.3. Switching between offline and online modes
- 6.4. General settings
- 6.5. Network control
- 6.6. Advanced settings
- 6.6.1. Advanced radio settings
- 6.6.2. SFP settings
- 6.6.3. Static routes
- 6.6.4. Whitelists and Blacklists
- 6.6.5. Multicast
- 6.6.6. SNMP configuration
- 6.6.7. Wireless access point configuration
- 6.6.8. RADIUS configuration
- 6.6.9. NTP Configuration
- 6.6.10. L2TP configuration
- 6.6.11. VLAN settings
- 6.6.12. Fluidity settings
- 6.6.13. Miscellaneous settings
- 6.7. Management settings
- 6.7.1. View Mode settings
- 6.7.2. Changing the Administrator username and password
- 6.7.3. Overwriting and upgrading the unit firmware
- 6.7.4. Plug-In management
- 6.7.5. The device status view
- 6.7.6. Saving and restoring the unit settings
- 6.7.7. Resetting the unit to factory defaults
- 6.7.8. Logging out
- 6.7.9. Viewing the end-user license agreement
- 7. Software Plug-Ins
- 8. Troubleshooting
- 9. Electrical power requirements
- 10. Heat radiation data
- 11. Federal Communications Commission (FCC) radio interference statement
- 12. Notices and copyright
- 13. Fluidmesh end-user license agreement
- 13.1. Preamble
- 13.2. Notice
- 13.3. Definitions
- 13.4. License grant
- 13.5. Uses and restrictions on use
- 13.6. Open-source software
- 13.7. Termination
- 13.8. Feedback
- 13.9. Consent to use of data
- 13.10. Warranty disclaimer
- 13.11. Limitation of liability
- 13.12. Exclusion of liability for emergency services
- 13.13. Export control
- 13.14. General
- 14. Contact us

6.4.4. Spectral analysis
The Spectrum Graph window contains a static graph readout and
controls to detect radio-frequency interference that exists between local
Fluidmesh units transmitting and receiving in a specified frequency band.
The window can be used make the most efficient choice of center
frequency and channel width for radio links between units.
To use the Spectrum Graph window, do the following steps:
1. Click the -spectral analysis link under GENERAL SETTINGS in
the left-hand settings menu.
• The Spectrum Graph window will open in a new web
browser tab (Figure 29 (page 77)).
Figure 29. Spectrum Graph window (typical display)
• The Spectrum Graph readout will be empty.
2. Choose a range for the frequency band that must be scanned for
interference or excessive radio noise by doing either of the
following:
• Set the start and stop frequency selection to the system
defaults (4 950 MHz to 5 825 MHz) by clicking
the Default button.
• Enter custom start frequency and stop frequency values for
the frequency band that must be scanned for interference,
in the Start Frequency (MHz) and Stop Frequency (MHz)
fields.
3. In the Commands table, click the Start button.
• When the frequency scan is complete, the Spectrum Graph
window will show the scan result.
• Signal quality for each channel is shown as a function of
signal noise quantity (in decibel-milliwatts) at each
frequency. The higher the value shown on the graph, the
poorer the signal quality. A green display indicates high
Fluidmesh 4200 FIBER
© Fluidmesh Networks LLC Page 77 of 180