
Reference


Components
Point Array Lines
Description
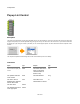
The Point Array Lines component draws a line through a set of points. This is similar to the Graph Lines component. However, in this case
both the x and y coordinates are supplied. As with the Graph Lines component, the y-coordinates are assumed to be in the range 0 to 1 ( –
1 to 1 if the graph is centred on zero). This means that you may need to use the Norm component if you want to make sure that your values
are all visible. The x-coordinates are automatically normalised so that they fit within the area of the graph.
By default the line drawn through the points is made from straight line segments. You can also choose to draw a best fit curve through the
points by setting the Curve input to True.
To generate a Point Array to use as input use the Graph to Point Array component.
Connectors
Inputs Type Outputs Type
View to draw onto
View The same View as the
input, but anything
connected here is
drawn on top
View
The area of the view
that the graph will be
drawn into
Area
The array of points Point Array
The pen defining the
colour, thickness and
style of the lines
Pen
True if the graph is
centred on zero, False
otherwise
Boolean
True if you want a
curved line, False
otherwise
Boolean
338 of 494