
Reference


Components
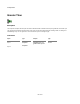
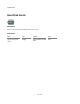
Graph Lines
Description
Draws a line through a set of points. The Float Array input supplies the y-coordinates. These are assumed to be in the range 0 to 1 ( –1 to 1
if the graph is centred on zero). This means that you may need to use the Norm component if you want to make sure that your values are all
visible. The x-coordinates are automatically generated and are equally spaced across the horizontal axis unless you set the Log input to True
in which case the x-coordinates will be logged.
By default the line drawn through the points is made from straight line segments. You can also choose to draw a best fit curve through the
points by setting the Curve input to True.
139 of 494