
User Manual


Operation
8
analysis difficult. You can analyze the building in more detail if you change the temperature
scale to values close to the temperature of the building.
Automatic Manual
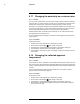
8.14.2.2 Example 2
Here are two infrared images of an isolator in a power line. To make it easier to analyze
the temperature variations in the isolator, the temperature scale in the right image has
been changed to values close to the temperature of the isolator.
Automatic Manual
8.14.3 Procedure
Follow this procedure:
1. Push the center of the navigation pad. This displays a toolbar.
2. On the toolbar, select Temperature scale
. This displays a toolbar.
3. On the toolbar, select one of the following:
• Auto
.
• Manual
.
4. To change the temperature span and the temperature level in Manual mode, do the
following:
• Push the navigation pad left/right to select (highlight) the maximum and/or minimum
temperature.
• Push the navigation pad up/down to change the value of the highlighted
temperature.
#T559828; r. AL/42258/42258; en-US
24