
User's Manual


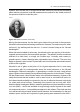


Table Of Contents
- Table of contents
- 1 Warnings & Cautions
- 2 Notice to user
- 3 Customer help
- 4 Documentation updates
- 5 Important note about this manual
- 6 Parts lists
- 7 Quick Start Guide
- 8 A note about ergonomics
- 9 Camera parts
- 10 Screen elements
- 11 Navigating the menu system
- 12 Connecting external devices and storage media
- 13 Pairing Bluetooth devices
- 14 Configuring Wi-Fi
- 15 Handling the camera
- 16 Working with images
- 17 Working with thermal fusion and picture-in-picture image modes
- 18 Working with measurement tools
- 19 Fetching data from external Extech meters
- 20 Working with isotherms
- 21 Annotating images
- 22 Recording video clips
- 23 Changing settings
- 24 Cleaning the camera
- 25 Technical data
- 26 Dimensional drawings
- 26.1 Camera dimensions, front view (1)
- 26.2 Camera dimensions, front view (2)
- 26.3 Camera dimensions, side view (1)
- 26.4 Camera dimensions, side view (2)
- 26.5 Camera dimensions, 41.3 mm/15° lens, side view
- 26.6 Camera dimensions, 24.6 mm/25° lens, side view
- 26.7 Camera dimensions, 13.1 mm/45° lens, side view
- 26.8 Infrared lens (41.3 mm/15°)
- 26.9 Infrared lens (24.6 mm/25°)
- 26.10 Infrared lens (13.1 mm/45°)
- 26.11 Battery (1)
- 26.12 Battery (2)
- 26.13 Battery charger (1)
- 26.14 Battery charger (2)
- 26.15 Battery charger (3)
- 27 Application examples
- 28 Introduction to building thermography
- 28.1 Disclaimer
- 28.2 Important note
- 28.3 Typical field investigations
- 28.3.1 Guidelines
- 28.3.2 About moisture detection
- 28.3.3 Moisture detection (1): Low-slope commercial roofs
- 28.3.4 Moisture detection (2): Commercial & residential façades
- 28.3.5 Moisture detection (3): Decks & balconies
- 28.3.6 Moisture detection (4): Plumbing breaks & leaks
- 28.3.7 Air infiltration
- 28.3.8 Insulation deficiencies
- 28.4 Theory of building science
- 28.4.1 General information
- 28.4.2 The effects of testing and checking
- 28.4.3 Sources of disruption in thermography
- 28.4.4 Surface temperature and air leaks
- 28.4.5 Measuring conditions & measuring season
- 28.4.6 Interpretation of infrared images
- 28.4.7 Humidity & dew point
- 28.4.8 Excerpt from Technical Note ‘Assessing thermal bridging and insulation continuity’ (UK example)
- 29 Introduction to thermographic inspections of electrical installations
- 29.1 Important note
- 29.2 General information
- 29.3 Measurement technique for thermographic inspection of electrical installations
- 29.4 Reporting
- 29.5 Different types of hot spots in electrical installations
- 29.6 Disturbance factors at thermographic inspection of electrical installations
- 29.7 Practical advice for the thermographer
- 30 About FLIR Systems
- 31 Glossary
- 32 Thermographic measurement techniques
- 33 History of infrared technology
- 34 Theory of thermography
- 35 The measurement formula
- 36 Emissivity tables

33 History of infrared technology
Before the year 1800, the existence of the infrared portion of the electromagnetic
spectrum wasn't even suspected. The original significance of the infrared spectrum,
or simply ‘the infrared’ as it is often called, as a form of heat radiation is perhaps less
obvious today than it was at the time of its discovery by Herschel in 1800.
10398703;a1
Figure 33.1 Sir William Herschel (1738–1822)
The discovery was made accidentally during the search for a new optical material.
Sir William Herschel – Royal Astronomer to King George III of England, and already
famous for his discovery of the planet Uranus – was searching for an optical filter
material to reduce the brightness of the sun’s image in telescopes during solar obser-
vations. While testing different samples of colored glass which gave similar reductions
in brightness he was intrigued to find that some of the samples passed very little of
the sun’s heat, while others passed so much heat that he risked eye damage after
only a few seconds’ observation.
Herschel was soon convinced of the necessity of setting up a systematic experiment,
with the objective of finding a single material that would give the desired reduction in
brightness as well as the maximum reduction in heat. He began the experiment by
actually repeating Newton’s prism experiment, but looking for the heating effect rather
than the visual distribution of intensity in the spectrum. He first blackened the bulb of
a sensitive mercury-in-glass thermometer with ink, and with this as his radiation de-
tector he proceeded to test the heating effect of the various colors of the spectrum
formed on the top of a table by passing sunlight through a glass prism. Other ther-
mometers, placed outside the sun’s rays, served as controls.
As the blackened thermometer was moved slowly along the colors of the spectrum,
the temperature readings showed a steady increase from the violet end to the red
end. This was not entirely unexpected, since the Italian researcher, Landriani, in a
similar experiment in 1777 had observed much the same effect. It was Herschel,
172 Publ. No. T559598 Rev. a554 – ENGLISH (EN) – September 27, 2011