
User's Manual


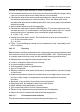


Table Of Contents
- Table of contents
- 1 Warnings & Cautions
- 2 Notice to user
- 3 Customer help
- 4 Documentation updates
- 5 Important note about this manual
- 6 Parts lists
- 7 Quick Start Guide
- 8 A note about ergonomics
- 9 Camera parts
- 10 Screen elements
- 11 Navigating the menu system
- 12 Connecting external devices and storage media
- 13 Pairing Bluetooth devices
- 14 Configuring Wi-Fi
- 15 Handling the camera
- 16 Working with images
- 17 Working with thermal fusion and picture-in-picture image modes
- 18 Working with measurement tools
- 19 Fetching data from external Extech meters
- 20 Working with isotherms
- 21 Annotating images
- 22 Recording video clips
- 23 Changing settings
- 24 Cleaning the camera
- 25 Technical data
- 26 Dimensional drawings
- 26.1 Camera dimensions, front view (1)
- 26.2 Camera dimensions, front view (2)
- 26.3 Camera dimensions, side view (1)
- 26.4 Camera dimensions, side view (2)
- 26.5 Camera dimensions, 41.3 mm/15° lens, side view
- 26.6 Camera dimensions, 24.6 mm/25° lens, side view
- 26.7 Camera dimensions, 13.1 mm/45° lens, side view
- 26.8 Infrared lens (41.3 mm/15°)
- 26.9 Infrared lens (24.6 mm/25°)
- 26.10 Infrared lens (13.1 mm/45°)
- 26.11 Battery (1)
- 26.12 Battery (2)
- 26.13 Battery charger (1)
- 26.14 Battery charger (2)
- 26.15 Battery charger (3)
- 27 Application examples
- 28 Introduction to building thermography
- 28.1 Disclaimer
- 28.2 Important note
- 28.3 Typical field investigations
- 28.3.1 Guidelines
- 28.3.2 About moisture detection
- 28.3.3 Moisture detection (1): Low-slope commercial roofs
- 28.3.4 Moisture detection (2): Commercial & residential façades
- 28.3.5 Moisture detection (3): Decks & balconies
- 28.3.6 Moisture detection (4): Plumbing breaks & leaks
- 28.3.7 Air infiltration
- 28.3.8 Insulation deficiencies
- 28.4 Theory of building science
- 28.4.1 General information
- 28.4.2 The effects of testing and checking
- 28.4.3 Sources of disruption in thermography
- 28.4.4 Surface temperature and air leaks
- 28.4.5 Measuring conditions & measuring season
- 28.4.6 Interpretation of infrared images
- 28.4.7 Humidity & dew point
- 28.4.8 Excerpt from Technical Note ‘Assessing thermal bridging and insulation continuity’ (UK example)
- 29 Introduction to thermographic inspections of electrical installations
- 29.1 Important note
- 29.2 General information
- 29.3 Measurement technique for thermographic inspection of electrical installations
- 29.4 Reporting
- 29.5 Different types of hot spots in electrical installations
- 29.6 Disturbance factors at thermographic inspection of electrical installations
- 29.7 Practical advice for the thermographer
- 30 About FLIR Systems
- 31 Glossary
- 32 Thermographic measurement techniques
- 33 History of infrared technology
- 34 Theory of thermography
- 35 The measurement formula
- 36 Emissivity tables

The more the IR camera operator knows about the equipment that he or she is about
to inspect, the higher the quality of the inspection. But it is virtually impossible for an
IR thermographer to have detailed knowledge about all the different types of equipment
that can be controlled. It is therefore common practice that a person responsible for
the equipment is present during the inspection.
29.2.3 Inspection
The preparation of the inspection should include the choice of the right type of report.
It is often necessary to use complementary equipment such as ampere meters in order
to measure the current in the circuits where defects were found. An anemometer is
necessary if you want to measure the wind speed at inspection of outdoor equipment.
Automatic functions help the IR operator to visualize an IR image of the components
with the right contrast to allow easy identification of a fault or a hot spot. It is almost
impossible to miss a hot spot on a scanned component. A measurement function will
also automatically display the hottest spot within an area in the image or the difference
between the maximum temperature in the chosen area and a reference, which can
be chosen by the operator, for example the ambient temperature.
10712703;a3
Figure 29.1 An infrared and a visual image of a power line isolator
When the fault is clearly identified and the IR thermographer has made sure that it is
not a reflection or a naturally occurring hot spot, the collection of the data starts, which
will allow the correct reporting of the fault. The emissivity, the identification of the
component, and the actual working conditions, together with the measured tempera-
ture, will be used in the report. In order to make it easy to identify the component a
visual photo of the defect is often taken.
29.2.4 Classification & reporting
Reporting has traditionally been the most time-consuming part of the IR survey. A
one-day inspection could result in one or two days’ work to report and classify the
found defects. This is still the case for many thermographers, who have chosen not
to use the advantages that computers and modern reporting software have brought
to IR condition monitoring.
Publ. No. T559598 Rev. a554 – ENGLISH (EN) – September 27, 2011 137
29 – Introduction to thermographic inspections of electrical installations