
User's Manual Part 2
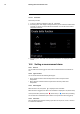
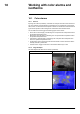
Table Of Contents
- 15 Working with image modes
- 16 Working with measurement tools
- 16.1 General
- 16.2 Adding/removing measurement tools
- 16.3 Working with user presets
- 16.4 Resizing or moving a measurement tool
- 16.5 Changing object parameters
- 16.6 Displaying values in the result table and displaying a graph
- 16.7 Creating and setting up a difference calculation
- 16.8 Setting a measurement alarm
- 17 Fetching data from external FLIR meters
- 18 Working with color alarms and isotherms
- 19 Annotating images
- 20 Programming the camera (time lapse)
- 21 Recording video clips
- 22 Screening alarm
- 23 Changing settings
- 24 Technical data
- 24.1 Online field-of-view calculator
- 24.2 Note about technical data
- 24.3 Note about authoritative versions
- 24.4 FLIR T600 15° (incl. Wi-Fi and Ext. cal.)
- 24.5 FLIR T600 15° (incl. Wi-Fi)
- 24.6 FLIR T600 25° (incl. Wi-Fi and Ext. cal.)
- 24.7 FLIR T600 25° (incl. Wi-Fi)
- 24.8 FLIR T600 25° and 15° w/case
- 24.9 FLIR T600 25° and 45° w/case
- 24.10 FLIR T600 45° (incl. Wi-Fi and Ext. cal.)
- 24.11 FLIR T600 45° (incl. Wi-Fi)
- 24.12 FLIR T600bx 25° (incl. Wi-Fi and Ext. cal.)
- 24.13 FLIR T600bx 25° (incl. Wi-Fi)
- 24.14 FLIR T600bx 45° (incl. Wi-Fi and Ext. cal.)
- 24.15 FLIR T600bx 45° (incl. Wi-Fi)
- 24.16 FLIR T610 15° (incl. Wi-Fi)
- 24.17 FLIR T610 25° (incl. Wi-Fi)
- 24.18 FLIR T610 45° (incl. Wi-Fi)
- 24.19 FLIR T620 15° (incl. Wi-Fi and Ext. cal.)
- 24.20 FLIR T620 15° (incl. Wi-Fi)
- 24.21 FLIR T620 25° (incl. Wi-Fi and Ext. cal.)
- 24.22 FLIR T620 25° (incl. Wi-Fi)
- 24.23 FLIR T620 25° and 15° (incl. Wi-Fi)
- 24.24 FLIR T620 25° and 45° (incl. Wi-Fi)
- 24.25 FLIR T620 45° (incl. Wi-Fi and Ext. cal.)
- 24.26 FLIR T620 45° (incl. Wi-Fi)
- 24.27 FLIR T620bx 15° (incl. Wi-Fi and Ext. cal.)
- 24.28 FLIR T620bx 15° (incl. Wi-Fi)
- 24.29 FLIR T620bx 25° (incl. Wi-Fi and Ext. cal.)
- 24.30 FLIR T620bx 25° (incl. Wi-Fi)
- 24.31 FLIR T620bx 45° (incl. Wi-Fi and Ext. cal.)
- 24.32 FLIR T620bx 45° (incl. Wi-Fi)
- 24.33 FLIR T630 15° (incl. Wi-Fi)
- 24.34 FLIR T630 25° (incl. Wi-Fi)
- 24.35 FLIR T630 45° (incl. Wi-Fi)
- 24.36 FLIR T630sc 15° (incl. Wi-Fi)
- 24.37 FLIR T630sc 25° (incl. Wi-Fi)
- 24.38 FLIR T630sc 25° and 45° w/case
- 24.39 FLIR T630sc 45° (incl. Wi-Fi)
- 24.40 FLIR T640 15° (incl. Wi-Fi and Ext. cal.)
- 24.41 FLIR T640 15° (incl. Wi-Fi)
- 24.42 FLIR T640 25° (incl. Wi-Fi and Ext. cal.)
- 24.43 FLIR T640 25° (incl. Wi-Fi)
- 24.44 FLIR T640 25° and 15° (incl. Wi-Fi)
- 24.45 FLIR T640 25° and 45° (incl. Wi-Fi)
- 24.46 FLIR T640 45° (incl. Wi-Fi and Ext. cal.)
- 24.47 FLIR T640 45° (incl. Wi-Fi)
- 24.48 FLIR T640bx 15° (incl. Wi-Fi and Ext. cal.)
- 24.49 FLIR T640bx 15° (incl. Wi-Fi)
- 24.50 FLIR T640bx 25° (incl. Wi-Fi and Ext. cal.)
- 24.51 FLIR T640bx 25° (incl. Wi-Fi)
- 24.52 FLIR T640bx 45° (incl. Wi-Fi and Ext. cal.)
- 24.53 FLIR T640bx 45° (incl. Wi-Fi)
- 24.54 FLIR T650sc 15° (incl. Wi-Fi)
- 24.55 FLIR T650sc 25° (incl. Wi-Fi)
- 24.56 FLIR T650sc 25° and 15° w/case
- 24.57 FLIR T650sc 25° and 45° w/case
- 24.58 FLIR T650sc 45° (incl. Wi-Fi)
- 24.59 FLIR T660 15° (incl. Wi-Fi and Ext. cal.)
- 24.60 FLIR T660 15° (incl. Wi-Fi)
- 24.61 FLIR T660 25° (incl. Wi-Fi and Ext. cal.)
- 24.62 FLIR T660 25° (incl. Wi-Fi)
- 24.63 FLIR T660 25° and 15° w/case
- 24.64 FLIR T660 25° and 45° w/case
- 24.65 FLIR T660 45° (incl. Wi-Fi and Ext. cal.)

Working with measurement tools16
16.6 Displaying values in the result table and
displaying a graph
16.6.1 General
For the box, circle, and line tools, you can set the camera to display the maximum, mini-
mum, and average values in the result table.
For the line tool, you can also display a graph.
16.6.2 Procedure
Follow this procedure:
1. To select the measurement tool, touch the tool on the screen. The tool is now dis-
played with one or more handles.
2. Push the joystick—or touch and hold the tool. This displays a context menu.
3. Use the joystick to go to (depending on the tool)
, , or (Max/Min/Avg/
Alarm) or (Graph/Max/Min/Avg/Alarm).
4. Push the joystick. This displays a submenu.
• (Option available for the line tool.) Select
(Graph) and push the joystick to dis-
play a graph.
• Select
(Max) and push the joystick to display the maximum value.
• Select
(Min) and push the joystick to display the minimum value.
• Select
(Avg) and push the joystick to display the average value.
• (Optional step.) You can choose to show or hide the maximum and minimum
markers (the hot/cold spots). Select
(Max & min markers) and push the joy-
stick to toggle:
◦ When
(icon with grey indicator) is displayed, the markers are hidden.
◦ When
(icon with blue indicator) is displayed, the markers are shown.
5. When completed, move the joystick down to close the submenu.
6. Select
(Done) and push the joystick.
16.7 Creating and setting up a difference
calculation
16.7.1 General
A difference calculation gives the difference between the values of two known measure-
ment results.
16.7.2 Procedure
Note
• You can set up a difference calculation when defining user presets, or when editing an
image in the archive.
• This procedure assumes that you have previously laid out at least one measurement
tool on the screen.
#T559880; r. AL/45866/46124; en-US
47