
User's Manual

19
system default is “Enabled” SNMP. If not, please enable on “System Management” of
“System Management Tool”.)
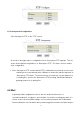
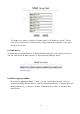
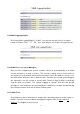
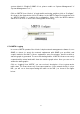
Click on “MRTG” from “Service” to begin traffic monitoring, and then click on “Configure”.
As shown in the figure below, full in IP address in the “MRTG Target” field, and then click
on “MRTG Rebuild” to complete the configuration. (Note: Here the MRTG address
stands for local host or other node needing traffic monitoring.)
6.7.2 MRTG Logging
In essence, MRTG operates like a kind of simple network management software. It uses
SNMP to detect (or query) the network equipments with SNMP you specified, and
compile statistics the traffic of these equipments every five minutes, based on which a
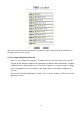
statistics graph is generated. The most fascinating feature of MRTG is that we can easily
comprehend the actual web traffic from the statistics graph alone. Here you can see its
exhaustive traffic graphs.
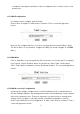
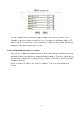
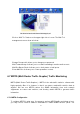
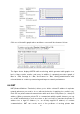
Click on “Logging” from “MRTG”, you can see basic description of host system and a
traffic chart. The chart shows only some representations. (If the network facility is only a
NIC, you will see a chart representing the traffic on the NIC ) as shown in the figure
below: