
Manual


2.7.3UsageGraphs
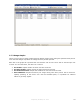
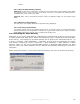
There are four builtin usage graphs that will display usage levels during the specified time period.
ClicktheDateRangedropdowntochangethetimeperiodreported.
Each bar in the graph will represent the next smaller unit of time. There will be two bars per unit
oftime:oneforsentfaxes,theotherforreceived.
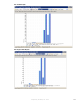
● FaxTraffic:Graphsnumberoffaxessentandreceived.
● FaxPageTraffic:Graphsnumberofpagessentandreceived.
● FaxConnectionTime:Graphscalldurationforsentandreceivedcalls.
● Port Utilization: Graphs maximum port usage during each time period. This is useful for
capacity planning. If the server ever uses all available ports, it is possible for inbound
callerstogetbusysignals.
ProprietaryFaxBack,Inc.2014 73