
Managing Faults on Virtual Services Platform 7200 Series and 8000 Series Version 5
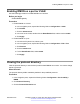

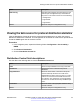
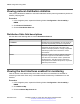
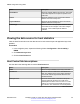
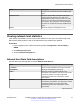
Table Of Contents
- Contents
- Chapter 1: Introduction
- Chapter 2: New in this document
- Chapter 3: Fault management fundamentals
- Chapter 4: Key Health Indicators using ACLI
- Chapter 5: Key Health Indicators using EDM
- Chapter 6: Link state change control using ACLI
- Chapter 7: Link state change control using EDM
- Chapter 8: RMON configuration using ACLI
- Chapter 9: RMON configuration using EDM
- Enabling RMON globally
- Enabling RMON on a port or VLAN
- Viewing the protocol directory
- Viewing the data source for protocol distribution statistics
- Viewing protocol distribution statistics
- Viewing the host interfaces enabled for monitoring
- Viewing address mappings
- Viewing the data source for host statistics
- Viewing network host statistics
- Viewing application host statistics
- Chapter 10: Log and trap fundamentals
- Chapter 11: Log configuration using ACLI
- Chapter 12: Log configuration using EDM
- Chapter 13: SNMP trap configuration using ACLI
- Chapter 14: SNMP trap configuration using EDM
- Glossary

Viewing protocol distribution statistics
View protocol distribution statistics to see traffic statistics that each protocol generates by local area
network (LAN) segment.
Procedure
1. In the navigation pane, expand the following folders: Configuration > Serviceability >
RMON.
2. Click Protocol Distribution.
3. Click the Distribution Stats tab.
Distribution Stats field descriptions
Use the data in the following table to use the Distribution Stats tab.
Name Description
LocalIndex Identifies the protocol distribution an entry is part of,
as well as the particular protocol that it represents.
Pkts Shows the number of packets without errors
received for this protocol type. This value is the
number of link-layer packets so a single, fragmented
network-layer packet can increment the counter
several times.
Octets Shows the number of octets in packets received for
this protocol type since it was added to the table.
This value does not include octets in packets that
contained errors. This value counts octets in the
entire packet that contained the protocol, not just the
particular protocol frames.
Viewing the host interfaces enabled for monitoring
View the entries in the address map control tab to see which host interfaces are enabled for
monitoring on the switch. Each entry in this table enables the discovery of addresses on a new
interface.
Procedure
1. In the navigation pane, expand the following folders: Configuration > Serviceability >
RMON.
2. Click Address Map.
3. Click the Address Map Control tab.
RMON configuration using EDM
December 2015 Managing Faults on Avaya VSP 7200 Series and 8000 Series 44
Comments on this document? infodev@avaya.com