
Managing Faults on Virtual Services Platform 7200 Series and 8000 Series Version 5

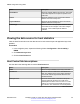
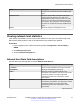
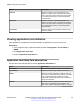
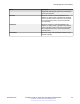
Table Of Contents
- Contents
- Chapter 1: Introduction
- Chapter 2: New in this document
- Chapter 3: Fault management fundamentals
- Chapter 4: Key Health Indicators using ACLI
- Chapter 5: Key Health Indicators using EDM
- Chapter 6: Link state change control using ACLI
- Chapter 7: Link state change control using EDM
- Chapter 8: RMON configuration using ACLI
- Chapter 9: RMON configuration using EDM
- Enabling RMON globally
- Enabling RMON on a port or VLAN
- Viewing the protocol directory
- Viewing the data source for protocol distribution statistics
- Viewing protocol distribution statistics
- Viewing the host interfaces enabled for monitoring
- Viewing address mappings
- Viewing the data source for host statistics
- Viewing network host statistics
- Viewing application host statistics
- Chapter 10: Log and trap fundamentals
- Chapter 11: Log configuration using ACLI
- Chapter 12: Log configuration using EDM
- Chapter 13: SNMP trap configuration using ACLI
- Chapter 14: SNMP trap configuration using EDM
- Glossary

Name Description
MatrixConfig Describes and configures the probe support for the
network layer and application layer host tables for
this protocol. The values can be one of the following:
• notSupported
• supportedOff
• supportedOn
Owner Shows the entity that configured this entry.
Viewing the data source for protocol distribution statistics
View the Distribution Control tab to see the network segment data source on which the protocol
distribution statistics are measured. The management IP mentioned as a data source represents the
IP that the SNMP agent uses to access the switch.
Procedure
1. In the navigation pane, expand the following folders: Configuration > Serviceability >
RMON.
2. Click Protocol Distribution.
3. Click the Distribution Control tab.
Distribution Control field descriptions
Use the data in the following table to use the Distribution Control tab.
Name
Description
Index Shows a unique identifier for the entry in the table.
DataSource Specifies the source of data for this protocol
distribution.
DroppedFrames Shows the total number of frames that the probe
receives and drops but does not include in the
StatsDropEvents value. This event can occur if the
probe is out of resources and sheds the load from
this collection. This value does not include packets
that were not counted because they had MAC-layer
errors.
CreateTime Shows the value of the sysUpTime when the entry
was last activated.
Owner Shows the entity that configured this entry.
Viewing the data source for protocol distribution statistics
December 2015 Managing Faults on Avaya VSP 7200 Series and 8000 Series 43
Comments on this document? infodev@avaya.com