
Managing Faults on Avaya Virtual Services Platform 7200 Series and 8000 Series Version 4.2.1
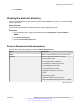
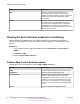
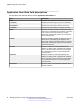
Table Of Contents
- Contents
- Chapter 1: Introduction
- Chapter 2: New in this release
- Chapter 3: Fault management fundamentals
- Chapter 4: Key Health Indicators using ACLI
- Chapter 5: Key Health Indicators using EDM
- Chapter 6: Link state change control using ACLI
- Chapter 7: Link state change control using EDM
- Chapter 8: RMON configuration using ACLI
- Chapter 9: RMON configuration using EDM
- Enabling RMON globally
- Enabling RMON on a port or VLAN
- Enabling RMON1 history
- Disabling RMON1 history
- Viewing RMON1 history statistics
- Creating an RMON1 alarm
- Creating an RMON1 port history alarm
- Viewing RMON1 alarms
- Deleting an RMON1 alarm
- Creating a default RMON1 event
- Creating a nondefault RMON1 event
- Viewing RMON1 events
- Viewing the RMON log
- Deleting an event
- Viewing the protocol directory
- Viewing the data source for protocol distribution statistics
- Viewing protocol distribution statistics
- Viewing the host interfaces enabled for monitoring
- Viewing address mappings
- Viewing the data source for host statistics
- Viewing network host statistics
- Viewing application host statistics
- Chapter 10: Viewing statistics using ACLI
- Chapter 11: Viewing statistics using EDM
- Chapter 12: Log and trap fundamentals
- Chapter 13: Log configuration using ACLI
- Chapter 14: Log configuration using EDM
- Chapter 15: SNMP trap configuration using ACLI
- Chapter 16: SNMP trap configuration using EDM
- Chapter 17: RMON alarm variables
- Glossary

3. Click the Network Host Stats tab.
Network Host Stats field descriptions
Use the data in the following table to use the Network Host Stats tab.
Name Description
LocalIndex Shows a unique identifier for the entry in the table.
HostAddress Shows the host address for this entry.
InPkts Shows the number of packets without errors
transmitted to this address. This value is the number
of link-layer packets so a single, fragmented
network-layer packet can increment the counter
several times.
OutPkts Shows the number of packets without errors
transmitted by this address. This value is the number
of link-layer packets so a single, fragmented
network-layer packet can increment the counter
several times.
InOctets Shows the number of octets transmitted to this
address, excluding octets in packets that contained
errors. This value counts octets in the entire packet
that contained the protocol, not just the particular
protocol frames.
OutOctets Shows the number of octets transmitted by this
address, excluding octets in packets that contained
errors. This value counts octets in the entire packet
that contained the protocol, not just the particular
protocol frames.
CreateTime Shows the value of the sysUpTime when the entry
was last activated.
Viewing application host statistics
View application host statistics to see traffic statistics by application protocol for each host.
Procedure
1. In the navigation pane, expand the following folders: Configuration > Serviceability >
RMON.
2. Click Application Layer Host.
3. Click the Application Host Stats tab.
Viewing application host statistics
June 2015 Managing Faults on Avaya VSP 7200 Series and 8000 Series 67
Comments on this document? infodev@avaya.com