
Managing Faults on Avaya Virtual Services Platform 7200 Series and 8000 Series Version 4.2.1
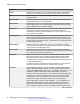
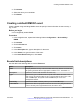
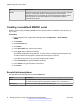
Table Of Contents
- Contents
- Chapter 1: Introduction
- Chapter 2: New in this release
- Chapter 3: Fault management fundamentals
- Chapter 4: Key Health Indicators using ACLI
- Chapter 5: Key Health Indicators using EDM
- Chapter 6: Link state change control using ACLI
- Chapter 7: Link state change control using EDM
- Chapter 8: RMON configuration using ACLI
- Chapter 9: RMON configuration using EDM
- Enabling RMON globally
- Enabling RMON on a port or VLAN
- Enabling RMON1 history
- Disabling RMON1 history
- Viewing RMON1 history statistics
- Creating an RMON1 alarm
- Creating an RMON1 port history alarm
- Viewing RMON1 alarms
- Deleting an RMON1 alarm
- Creating a default RMON1 event
- Creating a nondefault RMON1 event
- Viewing RMON1 events
- Viewing the RMON log
- Deleting an event
- Viewing the protocol directory
- Viewing the data source for protocol distribution statistics
- Viewing protocol distribution statistics
- Viewing the host interfaces enabled for monitoring
- Viewing address mappings
- Viewing the data source for host statistics
- Viewing network host statistics
- Viewing application host statistics
- Chapter 10: Viewing statistics using ACLI
- Chapter 11: Viewing statistics using EDM
- Chapter 12: Log and trap fundamentals
- Chapter 13: Log configuration using ACLI
- Chapter 14: Log configuration using EDM
- Chapter 15: SNMP trap configuration using ACLI
- Chapter 16: SNMP trap configuration using EDM
- Chapter 17: RMON alarm variables
- Glossary

Disabling RMON1 history
About this task
Disable RMON1 history on a port if you do not want to record a statistical sample from that port.
Procedure
1. In the navigation tree, expand the following folders: Configuration > Serviceability >
RMON.
2. Click Control.
3. In the History tab, select the row that contains the port ID to delete.
4. Click Delete.
Viewing RMON1 history statistics
View RMON1 history statistics when you want to see a statistical sample from the switch. You can
create a graph of the statistics in a bar, pie, chart, or line format.
Procedure
1. In the Device Physical View, select a port.
2. In the navigation tree, expand the following folders: Configuration > Graph
3. Click Port.
4. Click the RMON History tab.
5. Select the statistics you want to graph.
6. Click the button for the type of graph you require (bar, pie, chart, or line).
RMON History field descriptions
Use the data in the following table to use the RMON History tab.
Table 7: Variable definitions
Parameter
Description
SampleIndex Identifies the particular sample this entry represents among all samples
associated with the same history control entry. This index starts at one and
increases by one as each new sample is taken.
Utilization Specifies the best estimate of the mean physical layer network utilization on
this interface during the sampling interval, in hundredths of a percent.
Table continues…
Disabling RMON1 history
June 2015 Managing Faults on Avaya VSP 7200 Series and 8000 Series 51
Comments on this document? infodev@avaya.com