
Managing Faults on Avaya Virtual Services Platform 7200 Series and 8000 Series Version 4.2.1
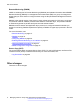
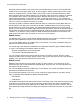
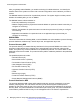
Table Of Contents
- Contents
- Chapter 1: Introduction
- Chapter 2: New in this release
- Chapter 3: Fault management fundamentals
- Chapter 4: Key Health Indicators using ACLI
- Chapter 5: Key Health Indicators using EDM
- Chapter 6: Link state change control using ACLI
- Chapter 7: Link state change control using EDM
- Chapter 8: RMON configuration using ACLI
- Chapter 9: RMON configuration using EDM
- Enabling RMON globally
- Enabling RMON on a port or VLAN
- Enabling RMON1 history
- Disabling RMON1 history
- Viewing RMON1 history statistics
- Creating an RMON1 alarm
- Creating an RMON1 port history alarm
- Viewing RMON1 alarms
- Deleting an RMON1 alarm
- Creating a default RMON1 event
- Creating a nondefault RMON1 event
- Viewing RMON1 events
- Viewing the RMON log
- Deleting an event
- Viewing the protocol directory
- Viewing the data source for protocol distribution statistics
- Viewing protocol distribution statistics
- Viewing the host interfaces enabled for monitoring
- Viewing address mappings
- Viewing the data source for host statistics
- Viewing network host statistics
- Viewing application host statistics
- Chapter 10: Viewing statistics using ACLI
- Chapter 11: Viewing statistics using EDM
- Chapter 12: Log and trap fundamentals
- Chapter 13: Log configuration using ACLI
- Chapter 14: Log configuration using EDM
- Chapter 15: SNMP trap configuration using ACLI
- Chapter 16: SNMP trap configuration using EDM
- Chapter 17: RMON alarm variables
- Glossary

Within EDM, you can configure RMON1 alarms that relate to specific events or variables. You can
also specify events associated with alarms to trap or log-and-trap. In turn, the system traps or logs
tripped alarms.
You can view all RMON1 information using ACLI or EDM. Alternatively, you can use any
management application that supports SNMP traps to view RMON1 trap information.
This section describes RMON1 alarms, RMON1 history, RMON1 events, and RMON1 statistics.
RMON1 alarms
You can configure alarms to alert you if the value of a variable goes out of range. You can define
RMON1 alarms on any MIB variable that resolves to an integer value. You cannot use string
variables (such as system description) as alarm variables.
You can use RMON1 alarms for the MAC layer in the network. You cannot use RMON1 alarms for
application and network layer protocols.
All alarms share the following characteristics:
• A defined upper and lower threshold value.
• A corresponding rising and falling event.
• An alarm interval or polling period.
After you activate alarms, you can:
• View the activity in a log or a trap log.
• Create a script directing the system to sound an audible alert at a console.
• Create a script directing the system to send an e-mail.
• Create a script directing the system to call a pager.
The system polls the alarm variable and the system compares the result against upper and lower
limit values you select when you create the alarm. If the system reaches or crosses the alarm
variable during the polling period, the alarm fires and generates an event that you can view in the
event log or the trap log. You can configure the alarm to either create a log, or have the alarm send
a Simple Network Management Protocol (SNMP) trap to a Network Management System (NMS).
You can view the activity in a log or a trap log, or you can create a script to cause a console to beep,
send an e-mail, or call a pager.
The upper limit of the alarm is the rising value, and the lower limit is the falling value. RMON1
periodically samples data based upon the alarm interval. During the first interval that the data
passes above the rising value, the alarm fires as a rising event. During the first interval that the data
drops below the falling value, the alarm fires as a falling event.
The following figure shows how alarms fire:
Fault management fundamentals
16 Managing Faults on Avaya VSP 7200 Series and 8000 Series June 2015
Comments on this document? infodev@avaya.com