
Troubleshooting Guide


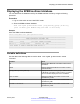


Table Of Contents
- Contents
- Chapter 1: Introduction
- Chapter 2: Safety messages
- Chapter 3: New in this document
- Chapter 4: Data collection required for Technical Support cases
- Chapter 5: Troubleshooting planning fundamentals
- Chapter 6: Troubleshooting fundamentals
- Chapter 7: Troubleshooting tool fundamentals
- Chapter 8: Log and trap fundamentals
- Chapter 9: Log configuration using ACLI
- Configuring a UNIX system log and syslog host
- Configuring secure forwarding
- Installing root certificate for syslog client
- Configuring logging
- Configuring the remote host address for log transfer
- Configuring system logging to external storage
- Configuring system message control
- Extending system message control
- Viewing logs
- Configuring ACLI logging
- Chapter 10: Log configuration using EDM
- Chapter 11: SNMP trap configuration using ACLI
- Chapter 12: SNMP trap configuration using EDM
- Chapter 13: Traps reference
- Chapter 14: Hardware troubleshooting
- Chapter 15: Software troubleshooting
- Chapter 16: Software troubleshooting tool configuration using ACLI
- Using ACLI for troubleshooting
- Using software record dumps
- Using trace to diagnose problems
- Using trace to diagnose IPv6 problems
- Viewing and deleting debug files
- Configuring port mirroring
- Configuring global mirroring actions with an ACL
- Configuring ACE actions to mirror
- Clearing ARP information for an interface
- Flushing routing, MAC, and ARP tables for an interface
- Pinging an IP device
- Running a traceroute test
- Showing SNMP logs
- Using trace to examine IS-IS control packets
- Viewing the metric type of IS-IS route in TLVs – detailed
- Viewing the metric type of IS-IS route in TLVs – summarized
- Chapter 17: Software troubleshooting tool configuration using EDM
- Chapter 18: Layer 1 troubleshooting
- Chapter 19: Operations and Management
- CFM fundamentals
- CFM configuration using ACLI
- Autogenerated CFM
- Configuring explicit mode CFM
- Displaying SPBM nodal configuration
- Configuring simplified CFM SPBM
- Triggering a loopback test (LBM)
- Triggering linktrace (LTM)
- Triggering a Layer 2 ping
- Triggering a Layer 2 traceroute
- Triggering a Layer 2 tracetree
- Triggering a Layer 2 tracemroute
- Using trace CFM to diagnose problems
- Using trace SPBM to diagnose problems
- CFM configuration using EDM
- Autogenerated CFM
- Configuring explicit CFM
- Configuring Layer 2 ping
- Initiating a Layer 2 traceroute
- Viewing Layer 2 traceroute results
- Configuring Layer 2 IP ping
- Viewing Layer 2 IP Ping results
- Configuring Layer 2 IP traceroute
- Viewing Layer 2 IP traceroute results
- Triggering a loopback test
- Triggering linktrace
- Viewing linktrace results
- Configuring Layer 2 tracetree
- Viewing Layer 2 tracetree results
- Configuring Layer 2 trace multicast route on a VLAN
- Configuring Layer 2 tracemroute on a VRF
- Viewing Layer 2 trace multicast route results
- CFM configuration example
- Chapter 20: Upper layer troubleshooting
- Troubleshooting SNMP
- Troubleshooting DHCP
- Troubleshooting DHCP Relay
- Troubleshooting client connection to the DHCP server
- Troubleshooting IPv6 DHCP Relay
- IPv6 DHCP Relay switch side troubleshooting
- IPv6 DHCP Relay server side troubleshooting
- IPv6 DHCP Relay client side troubleshooting
- Enabling trace messages for IPv6 DHCP Relay
- Troubleshooting IPv6 VRRP
- VRRP transitions
- Enabling trace messages for IPv6 VRRP troubleshooting
- Risks associated with enabling trace messages
- VRRP with higher priority running as backup
- Downgrading or upgrading from releases that support different key sizes
- Troubleshooting IPv6 connectivity loss
- Troubleshooting TACACS+
- Troubleshooting RSMLT
- Chapter 21: Unicast routing troubleshooting
- Chapter 22: Multicast troubleshooting
- Chapter 23: Multicast routing troubleshooting using ACLI
- Viewing IGMP interface information
- Viewing multicast group trace information for IGMP snoop
- Viewing IGMP group information
- Showing the hardware resource usage
- Using PIM debugging commands
- Determining the protocol configured on the added VLAN
- Determining the data stream learned with IP Multicast over Fabric Connect on the VLAN
- Displaying the SPBM multicast database
- Troubleshooting IP Multicast over Fabric Connect for Layer 2 VSNs
- Troubleshooting IP Multicast over Fabric Connect for Layer 3 VSNs
- Troubleshooting IP Multicast over Fabric Connect for IP Shortcuts
- Defining the IS-IS trace flag for IP multicast
- Chapter 24: Multicast routing troubleshooting using EDM
- Viewing IGMP interface information
- Viewing IGMP snoop trace information
- Viewing IGMP group information
- Viewing multicast group sources
- Viewing multicast routes by egress VLAN
- Enabling multicast routing process statistics
- Determining the data stream learned when IP Multicast over Fabric Connect is configured on the VLAN
- Showing the SPBM multicast database
- Chapter 25: Transparent Port UNI feature troubleshooting using ACLI
- Chapter 26: Troubleshooting MACsec
- Chapter 27: Troubleshooting MACsec using EDM
- Chapter 28: Troubleshooting Fabric Attach
- Troubleshooting Fabric Attach using the ACLI
- Troubleshooting Fabric Attach using the EDM
- Fabric Attach troubleshooting example

Field Description
EXPLICIT HOST TRACKING Indicates if explicit host tracking is enabled to track all the source and
group members.
Determining the data stream learned with IP Multicast over
Fabric Connect on the VLAN
Use this procedure to determine the data stream learned when IP Multicast over Fabric Connect is
configured on the VLAN.
About this task
The following section shows sample output for the show ip mroute route command.
In this table, every stream uses one (*,G) entry and x (S,G) entries, depending on how many servers
forward traffic to the same group.
The 0.0.0.0 mask is always tied to a (*,G) entry.
If you do not specify a VRF name or range of VRF IDs, the results display information for the Global
Router. If you do specify a VRF name or range of VRF IDs, the results display information only for
the VRFs you specify.
Procedure
1. Log on to the switch to enter User EXEC mode.
2. Determine the data stream learned:
show ip mroute route [vrf WORD <0–32>] [vrfids <0–255>]
Example
Determine the data stream learned:
Switch:1#show ip mroute route
================================================================================
Mroute Route
================================================================================
GROUP SOURCE SRCMASK UPSTREAM_NBR IF EXPIR PROT
--------------------------------------------------------------------------------
233.252.0.119 0.0.0.0 0.0.0.0 203.0.113.207 v504 210 pimsm
233.252.0.119 192.0.2.165 255.255.255.0 203.0.113.207 v504 210 pimsm
233.252.0.119 198.51.100.165 255.255.255.0 198.51.100.204 v155 210 pimsm
233.252.0.119 198.51.100.166 255.255.255.0 198.51.100.204 v155 210 pimsm
233.252.0.113 0.0.0.0 0.0.0.0 203.0.113.208 v504 210 pimsm
233.252.0.113 198.51.100.165 255.255.255.0 203.0.113.208 v504 210 pimsm
Variable definitions
Use the data in the following table to use the show ip mroute route command.
Determining the data stream learned with IP Multicast over Fabric Connect on the VLAN
January 2017 Troubleshooting 281
Comments on this document? infodev@avaya.com