
Troubleshooting Guide


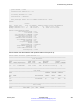


Table Of Contents
- Contents
- Chapter 1: Introduction
- Chapter 2: Safety messages
- Chapter 3: New in this document
- Chapter 4: Data collection required for Technical Support cases
- Chapter 5: Troubleshooting planning fundamentals
- Chapter 6: Troubleshooting fundamentals
- Chapter 7: Troubleshooting tool fundamentals
- Chapter 8: Log and trap fundamentals
- Chapter 9: Log configuration using ACLI
- Configuring a UNIX system log and syslog host
- Configuring secure forwarding
- Installing root certificate for syslog client
- Configuring logging
- Configuring the remote host address for log transfer
- Configuring system logging to external storage
- Configuring system message control
- Extending system message control
- Viewing logs
- Configuring ACLI logging
- Chapter 10: Log configuration using EDM
- Chapter 11: SNMP trap configuration using ACLI
- Chapter 12: SNMP trap configuration using EDM
- Chapter 13: Traps reference
- Chapter 14: Hardware troubleshooting
- Chapter 15: Software troubleshooting
- Chapter 16: Software troubleshooting tool configuration using ACLI
- Using ACLI for troubleshooting
- Using software record dumps
- Using trace to diagnose problems
- Using trace to diagnose IPv6 problems
- Viewing and deleting debug files
- Configuring port mirroring
- Configuring global mirroring actions with an ACL
- Configuring ACE actions to mirror
- Clearing ARP information for an interface
- Flushing routing, MAC, and ARP tables for an interface
- Pinging an IP device
- Running a traceroute test
- Showing SNMP logs
- Using trace to examine IS-IS control packets
- Viewing the metric type of IS-IS route in TLVs – detailed
- Viewing the metric type of IS-IS route in TLVs – summarized
- Chapter 17: Software troubleshooting tool configuration using EDM
- Chapter 18: Layer 1 troubleshooting
- Chapter 19: Operations and Management
- CFM fundamentals
- CFM configuration using ACLI
- Autogenerated CFM
- Configuring explicit mode CFM
- Displaying SPBM nodal configuration
- Configuring simplified CFM SPBM
- Triggering a loopback test (LBM)
- Triggering linktrace (LTM)
- Triggering a Layer 2 ping
- Triggering a Layer 2 traceroute
- Triggering a Layer 2 tracetree
- Triggering a Layer 2 tracemroute
- Using trace CFM to diagnose problems
- Using trace SPBM to diagnose problems
- CFM configuration using EDM
- Autogenerated CFM
- Configuring explicit CFM
- Configuring Layer 2 ping
- Initiating a Layer 2 traceroute
- Viewing Layer 2 traceroute results
- Configuring Layer 2 IP ping
- Viewing Layer 2 IP Ping results
- Configuring Layer 2 IP traceroute
- Viewing Layer 2 IP traceroute results
- Triggering a loopback test
- Triggering linktrace
- Viewing linktrace results
- Configuring Layer 2 tracetree
- Viewing Layer 2 tracetree results
- Configuring Layer 2 trace multicast route on a VLAN
- Configuring Layer 2 tracemroute on a VRF
- Viewing Layer 2 trace multicast route results
- CFM configuration example
- Chapter 20: Upper layer troubleshooting
- Troubleshooting SNMP
- Troubleshooting DHCP
- Troubleshooting DHCP Relay
- Troubleshooting client connection to the DHCP server
- Troubleshooting IPv6 DHCP Relay
- IPv6 DHCP Relay switch side troubleshooting
- IPv6 DHCP Relay server side troubleshooting
- IPv6 DHCP Relay client side troubleshooting
- Enabling trace messages for IPv6 DHCP Relay
- Troubleshooting IPv6 VRRP
- VRRP transitions
- Enabling trace messages for IPv6 VRRP troubleshooting
- Risks associated with enabling trace messages
- VRRP with higher priority running as backup
- Downgrading or upgrading from releases that support different key sizes
- Troubleshooting IPv6 connectivity loss
- Troubleshooting TACACS+
- Troubleshooting RSMLT
- Chapter 21: Unicast routing troubleshooting
- Chapter 22: Multicast troubleshooting
- Chapter 23: Multicast routing troubleshooting using ACLI
- Viewing IGMP interface information
- Viewing multicast group trace information for IGMP snoop
- Viewing IGMP group information
- Showing the hardware resource usage
- Using PIM debugging commands
- Determining the protocol configured on the added VLAN
- Determining the data stream learned with IP Multicast over Fabric Connect on the VLAN
- Displaying the SPBM multicast database
- Troubleshooting IP Multicast over Fabric Connect for Layer 2 VSNs
- Troubleshooting IP Multicast over Fabric Connect for Layer 3 VSNs
- Troubleshooting IP Multicast over Fabric Connect for IP Shortcuts
- Defining the IS-IS trace flag for IP multicast
- Chapter 24: Multicast routing troubleshooting using EDM
- Viewing IGMP interface information
- Viewing IGMP snoop trace information
- Viewing IGMP group information
- Viewing multicast group sources
- Viewing multicast routes by egress VLAN
- Enabling multicast routing process statistics
- Determining the data stream learned when IP Multicast over Fabric Connect is configured on the VLAN
- Showing the SPBM multicast database
- Chapter 25: Transparent Port UNI feature troubleshooting using ACLI
- Chapter 26: Troubleshooting MACsec
- Chapter 27: Troubleshooting MACsec using EDM
- Chapter 28: Troubleshooting Fabric Attach
- Troubleshooting Fabric Attach using the ACLI
- Troubleshooting Fabric Attach using the EDM
- Fabric Attach troubleshooting example

AuthPriv-md5 profile3
NoAuthNoPriv-md5 profile1
================================================================================
Target Address Configuration
================================================================================
Target Name TDomain TAddress TMask
--------------------------------------------------------------------------------
4c20cc369925edbd1fe3cf8e2584c498 ipv4 47.17.142.155:162
55fca382ffba169e986783bbbdedc334 ipv4 47.17.143.57:162
================================================================================
Target Address Configuration
================================================================================
Target Name Timeout Retry TagList
Params MMS
--------------------------------------------------------------------------------
4c20cc369925edbd1fe3cf8e2584c498 1500 3 trapTag
4c20cc369925edbd1fe3cf8e2584c498 484
55fca382ffba169e986783bbbdedc334 1500 3 trapTag
55fca382ffba169e986783bbbdedc334 484
================================================================================
Target Params Configuration
================================================================================
Target Name MP Model Security Name Sec
Level
--------------------------------------------------------------------------------
4c20cc369925edbd1fe3cf8e2584c498 snmpv1 readview noAu
thNoPriv
55fca382ffba169e986783bbbdedc334 snmpv2c secret noAu
thNoPriv
TparamV1 snmpv1 readview noAu
thNoPriv
TparamV2 snmpv2c readview noAu
thNoPriv
Troubleshooting TACACS+ problems
Use the trace level command to check traps and log files to see any TACACS+ failure. If
TACACS+ experiences failure conditions, the TACACS+ module sends SNMP traps to notify the
user. The TACACS+ module also logs the failure information into the system log file.
About this task
Caution:
Using the trace tool inappropriately can cause primary CPU lockup conditions, loss of access to
the device, loss of protocols, and service degradation. If you use trace level 3 (verbose) or trace
level 4 (very verbose), Avaya recommends that you do not use the screen to view commands
due to the volume of information the system generates and the effect on the system.
Troubleshooting TACACS+
January 2017 Troubleshooting 247
Comments on this document? infodev@avaya.com