
Troubleshooting Guide


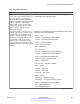
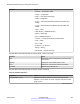


Table Of Contents
- Contents
- Chapter 1: Introduction
- Chapter 2: Safety messages
- Chapter 3: New in this document
- Chapter 4: Data collection required for Technical Support cases
- Chapter 5: Troubleshooting planning fundamentals
- Chapter 6: Troubleshooting fundamentals
- Chapter 7: Troubleshooting tool fundamentals
- Chapter 8: Log and trap fundamentals
- Chapter 9: Log configuration using ACLI
- Configuring a UNIX system log and syslog host
- Configuring secure forwarding
- Installing root certificate for syslog client
- Configuring logging
- Configuring the remote host address for log transfer
- Configuring system logging to external storage
- Configuring system message control
- Extending system message control
- Viewing logs
- Configuring ACLI logging
- Chapter 10: Log configuration using EDM
- Chapter 11: SNMP trap configuration using ACLI
- Chapter 12: SNMP trap configuration using EDM
- Chapter 13: Traps reference
- Chapter 14: Hardware troubleshooting
- Chapter 15: Software troubleshooting
- Chapter 16: Software troubleshooting tool configuration using ACLI
- Using ACLI for troubleshooting
- Using software record dumps
- Using trace to diagnose problems
- Using trace to diagnose IPv6 problems
- Viewing and deleting debug files
- Configuring port mirroring
- Configuring global mirroring actions with an ACL
- Configuring ACE actions to mirror
- Clearing ARP information for an interface
- Flushing routing, MAC, and ARP tables for an interface
- Pinging an IP device
- Running a traceroute test
- Showing SNMP logs
- Using trace to examine IS-IS control packets
- Viewing the metric type of IS-IS route in TLVs – detailed
- Viewing the metric type of IS-IS route in TLVs – summarized
- Chapter 17: Software troubleshooting tool configuration using EDM
- Chapter 18: Layer 1 troubleshooting
- Chapter 19: Operations and Management
- CFM fundamentals
- CFM configuration using ACLI
- Autogenerated CFM
- Configuring explicit mode CFM
- Displaying SPBM nodal configuration
- Configuring simplified CFM SPBM
- Triggering a loopback test (LBM)
- Triggering linktrace (LTM)
- Triggering a Layer 2 ping
- Triggering a Layer 2 traceroute
- Triggering a Layer 2 tracetree
- Triggering a Layer 2 tracemroute
- Using trace CFM to diagnose problems
- Using trace SPBM to diagnose problems
- CFM configuration using EDM
- Autogenerated CFM
- Configuring explicit CFM
- Configuring Layer 2 ping
- Initiating a Layer 2 traceroute
- Viewing Layer 2 traceroute results
- Configuring Layer 2 IP ping
- Viewing Layer 2 IP Ping results
- Configuring Layer 2 IP traceroute
- Viewing Layer 2 IP traceroute results
- Triggering a loopback test
- Triggering linktrace
- Viewing linktrace results
- Configuring Layer 2 tracetree
- Viewing Layer 2 tracetree results
- Configuring Layer 2 trace multicast route on a VLAN
- Configuring Layer 2 tracemroute on a VRF
- Viewing Layer 2 trace multicast route results
- CFM configuration example
- Chapter 20: Upper layer troubleshooting
- Troubleshooting SNMP
- Troubleshooting DHCP
- Troubleshooting DHCP Relay
- Troubleshooting client connection to the DHCP server
- Troubleshooting IPv6 DHCP Relay
- IPv6 DHCP Relay switch side troubleshooting
- IPv6 DHCP Relay server side troubleshooting
- IPv6 DHCP Relay client side troubleshooting
- Enabling trace messages for IPv6 DHCP Relay
- Troubleshooting IPv6 VRRP
- VRRP transitions
- Enabling trace messages for IPv6 VRRP troubleshooting
- Risks associated with enabling trace messages
- VRRP with higher priority running as backup
- Downgrading or upgrading from releases that support different key sizes
- Troubleshooting IPv6 connectivity loss
- Troubleshooting TACACS+
- Troubleshooting RSMLT
- Chapter 21: Unicast routing troubleshooting
- Chapter 22: Multicast troubleshooting
- Chapter 23: Multicast routing troubleshooting using ACLI
- Viewing IGMP interface information
- Viewing multicast group trace information for IGMP snoop
- Viewing IGMP group information
- Showing the hardware resource usage
- Using PIM debugging commands
- Determining the protocol configured on the added VLAN
- Determining the data stream learned with IP Multicast over Fabric Connect on the VLAN
- Displaying the SPBM multicast database
- Troubleshooting IP Multicast over Fabric Connect for Layer 2 VSNs
- Troubleshooting IP Multicast over Fabric Connect for Layer 3 VSNs
- Troubleshooting IP Multicast over Fabric Connect for IP Shortcuts
- Defining the IS-IS trace flag for IP multicast
- Chapter 24: Multicast routing troubleshooting using EDM
- Viewing IGMP interface information
- Viewing IGMP snoop trace information
- Viewing IGMP group information
- Viewing multicast group sources
- Viewing multicast routes by egress VLAN
- Enabling multicast routing process statistics
- Determining the data stream learned when IP Multicast over Fabric Connect is configured on the VLAN
- Showing the SPBM multicast database
- Chapter 25: Transparent Port UNI feature troubleshooting using ACLI
- Chapter 26: Troubleshooting MACsec
- Chapter 27: Troubleshooting MACsec using EDM
- Chapter 28: Troubleshooting Fabric Attach
- Troubleshooting Fabric Attach using the ACLI
- Troubleshooting Fabric Attach using the EDM
- Fabric Attach troubleshooting example

Variable Value
cfm level [<0-4>] Starts tracing by CFM.
• <0-4> specifies the trace level from 0–4, where 0 is disabled; 1
is very terse; 2 is terse; 3 is very verbose, 4 is verbose.
spbm isis level [<0-4>] Specifies exactly which IS-IS component to display.
• <0-4> specifies the trace level from 0–4, where 0 is disabled; 1
is very terse; 2 is terse; 3 is very verbose, 4 is verbose.
level [<0-234>] [<0-4>] Starts the trace by specifying the module ID and level.
<0-234> specifies the module ID. Module ID 119 represents the
IS-IS module.
Specifies the trace level:
• 0 — Disabled
• 1 — Very terse
• 2 — Terse
• 3 — Verbose
• 4 — Very verbose
shutdown Stops the trace operation.
screen {disable|enable} Enables or disables the display of trace output to the screen.
Important:
Avaya recommends you avoid using the screen to view
commands if you use trace level 3 (verbose) or trace level 4
(very verbose) due to the volume of information generated
and the effect on the system.
Use the data in the following table to use the save trace command.
Table 36: Variable definitions
Variable
Value
file WORD<1–99> Specifies the file name in one of the following formats:
• a.b.c.d: <file>
WORD<1–99> is a string of 1–99 characters.
Note:
If you do not specify a file name, the file name is systrace.txt.
Using trace to examine IS-IS control packets
January 2017 Troubleshooting 125
Comments on this document? infodev@avaya.com