
Performance Management on Virtual Services Platform 4000 Series Version 5.1.2
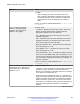
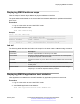
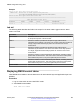
Table Of Contents
- Contents
- Chapter 1: Introduction
- Chapter 2: New in this document
- Chapter 3: Performance management fundamentals
- Chapter 4: Chassis performance management using EDM
- Chapter 5: Port performance management using ACLI
- Chapter 6: Port performance management using EDM
- Chapter 7: Statistics
- Viewing statistics using ACLI
- Viewing TCP statistics
- Viewing port routing statistics
- Displaying bridging statistics for specific ports
- Displaying DHCP-relay statistics for specific ports
- Displaying DHCP-relay statistics for all interfaces
- Viewing IPv6 DHCP Relay statistics
- Displaying LACP statistics for specific ports
- Displaying RMON statistics for specific ports
- Displaying detailed statistics for ports
- Displaying IS-IS statistics and counters
- Clearing ACL statistics
- Viewing ACE statistics
- Viewing MSTP statistics
- Viewing RSTP statistics
- Viewing RSTP port statistics
- Viewing MLT statistics
- Viewing vIST statistics
- Viewing IPv6 OSPF statistics
- Showing the EAPoL status of the device
- Showing EAPoL authenticator statistics
- Viewing EAPoL session statistics
- Viewing non-EAPoL MAC information
- Viewing port EAPoL operation statistics
- Showing RADIUS server statistics
- Viewing RMON statistics
- Displaying IPsec statistics
- Displaying IPsec statistics
- Viewing ICMP statistics
- Clearing IPv6 statistics
- Viewing IPv6 VRRP statistics
- Viewing IPv6 statistics on an interface
- Viewing IP VRRPv3 statistics
- Displaying VLACP statistics for specific ports
- Viewing statistics using EDM
- Graphing chassis statistics
- Graphing port statistics
- Viewing chassis system statistics
- Viewing chassis SNMP statistics
- Viewing chassis IP statistics
- Viewing chassis ICMP In statistics
- Viewing chassis ICMP Out statistics
- Viewing ICMP statistics
- Viewing chassis TCP statistics
- Viewing chassis UDP statistics
- Viewing port interface statistics
- Viewing port Ethernet errors statistics
- Viewing port bridging statistics
- Viewing port spanning tree statistics
- Viewing port routing statistics
- Viewing IPv6 statistics for an interface
- Viewing DHCP statistics for an interface
- Graphing DHCP statistics for a port
- Viewing DHCP statistics for a port
- Viewing IPv6 DHCP Relay statistics for a port
- Graphing DHCP statistics for a VLAN
- Displaying DHCP-relay statistics for Option 82
- Viewing LACP port statistics
- Viewing port policer statistics
- Displaying file statistics
- Viewing ACE port statistics
- Viewing ACL statistics
- Clearing ACL statistics
- Viewing VLAN and Spanning Tree CIST statistics
- Viewing VLAN and Spanning Tree MSTI statistics
- Viewing VRRP interface stats
- Viewing VRRP statistics
- Viewing SMLT statistics
- Viewing IPv6 VRRP statistics for an interface
- Viewing IPv6 VRRP statistics
- Viewing IP VRRPv3 statistics
- Viewing RSTP status statistics
- Viewing MLT interface statistics
- Viewing MLT Ethernet error statistics
- Viewing IPv6 OSPF statistics
- Displaying IPsec interface statistics
- Displaying switch level statistics for IPsec-enabled interfaces
- Viewing BGP global stats
- Viewing statistics for a VRF
- Viewing EAPoL Authenticator statistics
- Viewing EAPoL session statistics
- Viewing non-EAPoL MAC information
- Viewing Multihost status information
- Showing RADIUS server statistics
- Showing SNMP statistics
- Enabling RMON statistics
- Viewing RMON statistics
- Displaying IS-IS system statistics
- Displaying IS-IS interface counters
- Displaying IS-IS interface control packets
- Graphing IS-IS interface counters
- Graphing IS-IS interface sending control packet statistics
- Graphing IS-IS interface receiving control packet statistics
- Viewing statistics using ACLI
- Chapter 8: RMON configuration using ACLI
- Chapter 9: RMON configuration using EDM
- Enabling RMON globally
- Enabling RMON on a port or VLAN
- Enabling RMON1 history
- Disabling RMON1 history
- Viewing RMON1 history statistics
- Creating an RMON1 alarm
- Viewing RMON alarms
- Deleting an alarm
- Creating an RMON1 event
- Viewing RMON1 events
- Deleting an event
- Viewing the RMON log
- Viewing the protocol directory
- Viewing the data source for protocol distribution statistics
- Viewing protocol distribution statistics
- Viewing the host interfaces enabled for monitoring
- Viewing address mappings
- Viewing the data source for host statistics
- Viewing network host statistics
- Viewing application host statistics
- Chapter 10: Service Level Agreement Monitor
- Chapter 11: MACsec performance
- Chapter 12: RMON alarm variables

Variable Value
• buckets <1–65535>— Specifies the requested number of
discrete time intervals where the system saves data in the part
of the media-specific table associated with this history control
entry. The default value is 50.
• interval <1–3600>— Specifies the time interval in seconds
over which the system samples the data for each bucket in the
part of the media-specific table associated with this history
control entry. Because the counters in a bucket can overflow
at their maximum value with no indication, you must take into
account the possibility of overflow in all the associated
counters. Consider the minimum time in which a counter can
overflow on a particular media type, and then set the history
control interval to a value less than this interval, which is
typically most important for the octets counter in a media-
specific table. The default value is 1800.
• owner WORD<1–127>— Specifies the name of the owner.
stats <1-65535> {slot/port [/sub-port][-
slot/port[/sub-port][,...]} owner WORD<1–
127>
Configures RMON statistics.
• <1-65535>— Specifies the control Ether statistics entry index
number.
• {slot/port [/sub-port][-slot/port[/sub-port][,...]}— Specifies the
single port interface.
• owner WORD<1–127> — Specifies the name of the owner.
Use the no operator to delete a RMON Ether stats control
interface: no rmon stats[<1-65535>]
util-method [half|full] Configures whether port utilization is calculated in half or full
duplex to calculate port usage.
• half—Configures the string to half duplex.
• full—Configures the string to full duplex.
After you select half for half duplex, RMON uses InOctets and
the speed of the port to calculate port usage (this is the standard
RMON RFC 1271 convention). After you select full for full
duplex, RMON uses InOctets and OutOctets, and 2X the speed
of the port to calculate port usage. If you select full, but the port
operates in half-duplex mode, the calculation defaults to the
RFC1271 convention. The default is half.
Enabling Remote Monitoring on an interface
Use the following procedure to enable Remote Monitoring (RMON) on an interface.
Enabling Remote Monitoring on an interface
January 2017 Performance Management on Avaya VSP 4000 Series 155
Comments on this document? infodev@avaya.com