
Performance Management on Virtual Services Platform 4000 Series Version 5.1.2
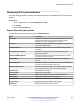
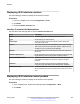
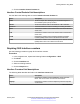
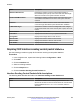
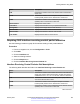
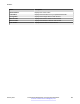
Table Of Contents
- Contents
- Chapter 1: Introduction
- Chapter 2: New in this document
- Chapter 3: Performance management fundamentals
- Chapter 4: Chassis performance management using EDM
- Chapter 5: Port performance management using ACLI
- Chapter 6: Port performance management using EDM
- Chapter 7: Statistics
- Viewing statistics using ACLI
- Viewing TCP statistics
- Viewing port routing statistics
- Displaying bridging statistics for specific ports
- Displaying DHCP-relay statistics for specific ports
- Displaying DHCP-relay statistics for all interfaces
- Viewing IPv6 DHCP Relay statistics
- Displaying LACP statistics for specific ports
- Displaying RMON statistics for specific ports
- Displaying detailed statistics for ports
- Displaying IS-IS statistics and counters
- Clearing ACL statistics
- Viewing ACE statistics
- Viewing MSTP statistics
- Viewing RSTP statistics
- Viewing RSTP port statistics
- Viewing MLT statistics
- Viewing vIST statistics
- Viewing IPv6 OSPF statistics
- Showing the EAPoL status of the device
- Showing EAPoL authenticator statistics
- Viewing EAPoL session statistics
- Viewing non-EAPoL MAC information
- Viewing port EAPoL operation statistics
- Showing RADIUS server statistics
- Viewing RMON statistics
- Displaying IPsec statistics
- Displaying IPsec statistics
- Viewing ICMP statistics
- Clearing IPv6 statistics
- Viewing IPv6 VRRP statistics
- Viewing IPv6 statistics on an interface
- Viewing IP VRRPv3 statistics
- Displaying VLACP statistics for specific ports
- Viewing statistics using EDM
- Graphing chassis statistics
- Graphing port statistics
- Viewing chassis system statistics
- Viewing chassis SNMP statistics
- Viewing chassis IP statistics
- Viewing chassis ICMP In statistics
- Viewing chassis ICMP Out statistics
- Viewing ICMP statistics
- Viewing chassis TCP statistics
- Viewing chassis UDP statistics
- Viewing port interface statistics
- Viewing port Ethernet errors statistics
- Viewing port bridging statistics
- Viewing port spanning tree statistics
- Viewing port routing statistics
- Viewing IPv6 statistics for an interface
- Viewing DHCP statistics for an interface
- Graphing DHCP statistics for a port
- Viewing DHCP statistics for a port
- Viewing IPv6 DHCP Relay statistics for a port
- Graphing DHCP statistics for a VLAN
- Displaying DHCP-relay statistics for Option 82
- Viewing LACP port statistics
- Viewing port policer statistics
- Displaying file statistics
- Viewing ACE port statistics
- Viewing ACL statistics
- Clearing ACL statistics
- Viewing VLAN and Spanning Tree CIST statistics
- Viewing VLAN and Spanning Tree MSTI statistics
- Viewing VRRP interface stats
- Viewing VRRP statistics
- Viewing SMLT statistics
- Viewing IPv6 VRRP statistics for an interface
- Viewing IPv6 VRRP statistics
- Viewing IP VRRPv3 statistics
- Viewing RSTP status statistics
- Viewing MLT interface statistics
- Viewing MLT Ethernet error statistics
- Viewing IPv6 OSPF statistics
- Displaying IPsec interface statistics
- Displaying switch level statistics for IPsec-enabled interfaces
- Viewing BGP global stats
- Viewing statistics for a VRF
- Viewing EAPoL Authenticator statistics
- Viewing EAPoL session statistics
- Viewing non-EAPoL MAC information
- Viewing Multihost status information
- Showing RADIUS server statistics
- Showing SNMP statistics
- Enabling RMON statistics
- Viewing RMON statistics
- Displaying IS-IS system statistics
- Displaying IS-IS interface counters
- Displaying IS-IS interface control packets
- Graphing IS-IS interface counters
- Graphing IS-IS interface sending control packet statistics
- Graphing IS-IS interface receiving control packet statistics
- Viewing statistics using ACLI
- Chapter 8: RMON configuration using ACLI
- Chapter 9: RMON configuration using EDM
- Enabling RMON globally
- Enabling RMON on a port or VLAN
- Enabling RMON1 history
- Disabling RMON1 history
- Viewing RMON1 history statistics
- Creating an RMON1 alarm
- Viewing RMON alarms
- Deleting an alarm
- Creating an RMON1 event
- Viewing RMON1 events
- Deleting an event
- Viewing the RMON log
- Viewing the protocol directory
- Viewing the data source for protocol distribution statistics
- Viewing protocol distribution statistics
- Viewing the host interfaces enabled for monitoring
- Viewing address mappings
- Viewing the data source for host statistics
- Viewing network host statistics
- Viewing application host statistics
- Chapter 10: Service Level Agreement Monitor
- Chapter 11: MACsec performance
- Chapter 12: RMON alarm variables

Viewing RMON statistics
Before you begin
• You must enable RMON statistics collection.
About this task
Use the following procedure to view RMON statistics for each port.
Procedure
1. In the Device Physical View, select a port.
2. In the navigation tree, expand the following folders: Configuration > Graph
3. Click Port.
4. Click the RMON tab.
5. Select the statistics you want to graph.
6. Select a graph type:
• bar
• pie
• chart
• line
RMON field descriptions
The following table describes fields on the RMON tab.
Name
Description
Octets Specifies the number of octets of data (including those in bad packets)
received on the network (excluding framing bits but including FCS octets).
You can use this object as a reasonable estimate of Ethernet utilization. If
additional precision is desired, sample the Pkts and Octets objects before
and after a common interval. The differences in the sampled values are Pkts
and Octets, and the number of seconds in the interval is Interval. These
values are used to calculate the Utilization as follows:
Pkts * (9.6+6.4) + (Octets * .8)
Utilization = ......................................
Interval * 10,000
The result of this equation is the value Utilization, which is the percent
utilization of the Ethernet segment on a scale of 0 to 100 percent.
Pkts Specifies the number of packets (including bad packets, broadcast packets,
and multicast packets) received.
Table continues…
Viewing statistics using EDM
January 2017 Performance Management on Avaya VSP 4000 Series 143
Comments on this document? infodev@avaya.com