
User's Guide
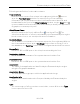
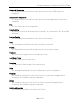
Table Of Contents
- ExtremeAnalytics® User GuideVersion 8.4
- Legal Notices
- Trademarks
- Contact
- Extreme Networks® Software License Agreement
- Table of Contents
- ExtremeAnalytics™ Help
- ExtremeAnalytics Licensing
- Configuring Enhanced Netflow for Extreme Analytics and Extreme Wireless Contr...
- How to Deploy ExtremeAnalytics in an MSP or MSSP Environment
- ExtremeAnalytics Tab Overview
- ExtremeAnalytics Dashboard Overview
- ExtremeAnalytics Insights Dashboard
- ExtremeAnalytics Tracked Applications Dashboard
- ExtremeAnalytics Browser Overview
- ExtremeAnalytics Application Flows
- ExtremeAnalytics Fingerprints Overview
- ExtremeAnalytics Custom Fingerprints
- Delete Custom Fingerprints
- Custom Fingerprint Examples
- Create Custom Fingerprints Based on Flow
- Create Custom Fingerprints Based on Destination Address
- Create Custom Fingerprints Based on Application or Application Group
- ExtremeAnalytics Packet Captures
- ExtremeAnalytics Configuration Overview
- Virtual Sensors
- ExtremeAnalytics Engine Advanced Configuration
- Flow Collection Type
- Collection Privacy Levels
- Client Aggregation
- Slow Client Data
- Max End-Systems in Hourly Details
- Sensor Log Levels
- Store Application Site Data
- ExtremeControl Integration
- Flow Sources/Application Telemetry Sources
- Web Credentials
- Configuration Properties
- Sensor Modules
- Auditing
- Network Settings
- ExtremeAnalytics Reports
- ExtremeAnalytics Report Descriptions
- Report Descriptions
- Analytics Events
- Bandwidth for a Client Over Time
- Interface Top Applications Treemap
- Sites Using the Most Bandwidth
- Most Popular Applications
- Most Used Applications for a Client
- Most Used Applications for a User Name
- Network Activity by Site
- Network Activity by Client
- Network Activity by Application
- Slowest Applications by Site
- Top Applications Group Radar
- Top Applications Radar
- Top Applications TreeMap
- Top Applications for Interface
- Top Applications for Server
- Top Clients by Interface
- Top Interfaces by Application
- Top N Applications
- Top N Clients
- Top N Servers
- Report Descriptions
- Add and Modify Fingerprints
- Add Fingerprints
- Enable or Disable Fingerprints
- Modify Fingerprints
- Update Fingerprints
- Custom Fingerprint Examples
- How to Deploy ExtremeAnalytics in an MSP or MSSP Environment
- ExtremeAnalytics Virtual Sensor Configuration in Extreme Management Center
- Stream Flow Data from ExtremeAnalytics into Splunk
- Stream Flow Data from ExtremeAnalytics into Elastic Stack

Options
93 of 218
and is not designed for historical long-term flow collection. A checkmark ( ) in
the table denotes a tracked application or a tracked site.
Unidirectional Flows
The Unidirectional table displays unidirectional flow data stored in memory. It
provides the raw non-aggregated flow data received from the flow sensors on
the network. It presents flow data for real-time troubleshooting purposes, and is
not designed for historical long-term flow collection. A checkmark ( ) in the
table denotes a tracked application or a tracked site.
Report Features
The Application Flows tables include several report features and functions that
allow you to drill down for more detailed application, site, response time,
mapping and policy functions. The report features vary, depending on the type
of data flow you select (Historical, Bidirectional and Unidirectional).
Interactive Tables
Manipulate table data in several ways to customize the view for your own needs:
l Select on the column headings to perform an ascending or descending sort on
the column data.
l Hide or display different columns by selecting on a column heading drop-
down arrow and selecting the column options from the menu.
l Filter data in each column by selecting on a column heading drop-down arrow
and using the Filters option on the menu.
The sort and filter functionality for these two tables behaves differently
than for other Extreme Management Center tables. In these tables, Max
Rows are considered for display, and then sorting and filtering is applied to
these rows. In other tables, sorting and filtering is applied to the entire
table, and then Max Rows of the result is displayed. For example, if the Max
Rows value is set to 50 and you create a filter for a specific IP address, only
those 50 rows will be filtered for the IP, not all the flows maintained in
memory on the server.
CSV Export
The CSV Export button allows you to save report data to a CSV file and to provide
report data in table form.