
User's Guide
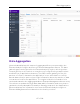
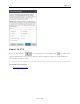
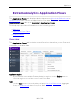
Table Of Contents
- ExtremeAnalytics® User GuideVersion 8.4
- Legal Notices
- Trademarks
- Contact
- Extreme Networks® Software License Agreement
- Table of Contents
- ExtremeAnalytics™ Help
- ExtremeAnalytics Licensing
- Configuring Enhanced Netflow for Extreme Analytics and Extreme Wireless Contr...
- How to Deploy ExtremeAnalytics in an MSP or MSSP Environment
- ExtremeAnalytics Tab Overview
- ExtremeAnalytics Dashboard Overview
- ExtremeAnalytics Insights Dashboard
- ExtremeAnalytics Tracked Applications Dashboard
- ExtremeAnalytics Browser Overview
- ExtremeAnalytics Application Flows
- ExtremeAnalytics Fingerprints Overview
- ExtremeAnalytics Custom Fingerprints
- Delete Custom Fingerprints
- Custom Fingerprint Examples
- Create Custom Fingerprints Based on Flow
- Create Custom Fingerprints Based on Destination Address
- Create Custom Fingerprints Based on Application or Application Group
- ExtremeAnalytics Packet Captures
- ExtremeAnalytics Configuration Overview
- Virtual Sensors
- ExtremeAnalytics Engine Advanced Configuration
- Flow Collection Type
- Collection Privacy Levels
- Client Aggregation
- Slow Client Data
- Max End-Systems in Hourly Details
- Sensor Log Levels
- Store Application Site Data
- ExtremeControl Integration
- Flow Sources/Application Telemetry Sources
- Web Credentials
- Configuration Properties
- Sensor Modules
- Auditing
- Network Settings
- ExtremeAnalytics Reports
- ExtremeAnalytics Report Descriptions
- Report Descriptions
- Analytics Events
- Bandwidth for a Client Over Time
- Interface Top Applications Treemap
- Sites Using the Most Bandwidth
- Most Popular Applications
- Most Used Applications for a Client
- Most Used Applications for a User Name
- Network Activity by Site
- Network Activity by Client
- Network Activity by Application
- Slowest Applications by Site
- Top Applications Group Radar
- Top Applications Radar
- Top Applications TreeMap
- Top Applications for Interface
- Top Applications for Server
- Top Clients by Interface
- Top Interfaces by Application
- Top N Applications
- Top N Clients
- Top N Servers
- Report Descriptions
- Add and Modify Fingerprints
- Add Fingerprints
- Enable or Disable Fingerprints
- Modify Fingerprints
- Update Fingerprints
- Custom Fingerprint Examples
- How to Deploy ExtremeAnalytics in an MSP or MSSP Environment
- ExtremeAnalytics Virtual Sensor Configuration in Extreme Management Center
- Stream Flow Data from ExtremeAnalytics into Splunk
- Stream Flow Data from ExtremeAnalytics into Elastic Stack

Options
86 of 218
Statistic
Statistics are quantitative data that can be collected for the selected target.
Available statistics vary depending on the selected target. Select the desired
statistic for the report:
l Bytes — The number of bytes transferred in both directions, between the client and
the server. Also known as bandwidth.
l Flows — The number of NetFlow records sent by the switch to report the traffic
between the client and the server.
l Application Response Time — The average amount of time for a server to respond to
a request.
l Network Response Time — The average amount of time to create a connection.
l Received Bytes — The number of bytes received by clients. This may be an estimated
number of bytes if you are using an Application Telemetry flow.
l Sent Bytes — The number of bytes sent by clients. This may be an estimated number
of bytes if you are using an Application Telemetry flow.
l Inbound Flows — The number of NetFlow records sent by the switch to report the
server-to-client traffic. This is a rough indication of the duration of client
connections.
l Outbound Flows — The number of NetFlow records sent by the switch to report the
client-to-server traffic. This is a rough indication of the duration of client
connections.
l Clients — The number of unique clients that have been seen associated with the
target.
l Servers — The number of unique servers that have been seen associated with the
target.
l Application Count — The number of unique applications seen for the selected target.
For byte, flow, and application count statistics, if you select a time range that
is larger that the interval, specify whether you want the data aggregated as a
summation of all the values for that statistic or as an average of all the values
for that statistic.
Start Time
Select the start time (duration) for the report: Last Interval, Today, Yesterday,
Last 24 Hours, Last 3 Days, or Last Week. You can also specify a custom start
time and end time for the report. The Last Interval is the most recent recorded
data covering a time period determined by the selected Data Table.