
User's Guide
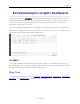
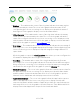
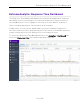
Table Of Contents
- ExtremeAnalytics® User GuideVersion 8.4
- Legal Notices
- Trademarks
- Contact
- Extreme Networks® Software License Agreement
- Table of Contents
- ExtremeAnalytics™ Help
- ExtremeAnalytics Licensing
- Configuring Enhanced Netflow for Extreme Analytics and Extreme Wireless Contr...
- How to Deploy ExtremeAnalytics in an MSP or MSSP Environment
- ExtremeAnalytics Tab Overview
- ExtremeAnalytics Dashboard Overview
- ExtremeAnalytics Insights Dashboard
- ExtremeAnalytics Tracked Applications Dashboard
- ExtremeAnalytics Browser Overview
- ExtremeAnalytics Application Flows
- ExtremeAnalytics Fingerprints Overview
- ExtremeAnalytics Custom Fingerprints
- Delete Custom Fingerprints
- Custom Fingerprint Examples
- Create Custom Fingerprints Based on Flow
- Create Custom Fingerprints Based on Destination Address
- Create Custom Fingerprints Based on Application or Application Group
- ExtremeAnalytics Packet Captures
- ExtremeAnalytics Configuration Overview
- Virtual Sensors
- ExtremeAnalytics Engine Advanced Configuration
- Flow Collection Type
- Collection Privacy Levels
- Client Aggregation
- Slow Client Data
- Max End-Systems in Hourly Details
- Sensor Log Levels
- Store Application Site Data
- ExtremeControl Integration
- Flow Sources/Application Telemetry Sources
- Web Credentials
- Configuration Properties
- Sensor Modules
- Auditing
- Network Settings
- ExtremeAnalytics Reports
- ExtremeAnalytics Report Descriptions
- Report Descriptions
- Analytics Events
- Bandwidth for a Client Over Time
- Interface Top Applications Treemap
- Sites Using the Most Bandwidth
- Most Popular Applications
- Most Used Applications for a Client
- Most Used Applications for a User Name
- Network Activity by Site
- Network Activity by Client
- Network Activity by Application
- Slowest Applications by Site
- Top Applications Group Radar
- Top Applications Radar
- Top Applications TreeMap
- Top Applications for Interface
- Top Applications for Server
- Top Clients by Interface
- Top Interfaces by Application
- Top N Applications
- Top N Clients
- Top N Servers
- Report Descriptions
- Add and Modify Fingerprints
- Add Fingerprints
- Enable or Disable Fingerprints
- Modify Fingerprints
- Update Fingerprints
- Custom Fingerprint Examples
- How to Deploy ExtremeAnalytics in an MSP or MSSP Environment
- ExtremeAnalytics Virtual Sensor Configuration in Extreme Management Center
- Stream Flow Data from ExtremeAnalytics into Splunk
- Stream Flow Data from ExtremeAnalytics into Elastic Stack

Insights
64 of 218
l Engines — The number at the center of the ring chart indicates how many engines
are represented by the chart. The colors in the graph indicate the states of the
configured engines. Hover over a ring color to display a tooltip with the status of
that engine. Click the graph to display overview and status details.
l Virtual Sensors — The number at the center of the ring chart indicates how many
virtual sensors are represented by the chart. The colors in the graph indicate the
states of the configured virtual sensors. Hover over a ring color to display a tooltip
with the status of that virtual sensor. Click the graph to display overview and status
details. Click the graph to open the Virtual Sensors tab.
l Disk Usage — The number at the center of the ring chart indicates the percentage of
Disk Usage. The colors in the graph display the percentage of disk usage being used.
Hover over the ring color to display a tooltip with usage percentage and units of
space details.
Click the graph to open the Configuration tab, where you can configure the
information displayed in the Insights Dashboard.
l Flow Rate — The number at the center of the ring chart indicates the flow rate
percentage. The colors in the graph indicate the flow rates for the different engines
being used. Hover over a ring color to display a tooltip with status, percentage and
rate details for each engine. Click the graph to open the Licenses tab.
l Network Response — The colors in the graph indicate the network response time for
the application/site. Hover over a ring color to display a tooltip with status details
and the number of networks at that status. Click a color in the graph to open the
Network Service dashboard, which displays network service details.
l Application Response — The colors in the graph indicate the application response
time for the application/site. Hover over a ring color to display a tooltip with
response time details and the number of applications within the expected response
time range. Click a color in the graph to open the Response Time dashboard, which
displays network and application response time charts and details.