
User's Guide
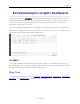
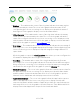
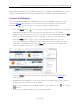
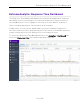
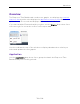
Table Of Contents
- ExtremeAnalytics® User GuideVersion 8.4
- Legal Notices
- Trademarks
- Contact
- Extreme Networks® Software License Agreement
- Table of Contents
- ExtremeAnalytics™ Help
- ExtremeAnalytics Licensing
- Configuring Enhanced Netflow for Extreme Analytics and Extreme Wireless Contr...
- How to Deploy ExtremeAnalytics in an MSP or MSSP Environment
- ExtremeAnalytics Tab Overview
- ExtremeAnalytics Dashboard Overview
- ExtremeAnalytics Insights Dashboard
- ExtremeAnalytics Tracked Applications Dashboard
- ExtremeAnalytics Browser Overview
- ExtremeAnalytics Application Flows
- ExtremeAnalytics Fingerprints Overview
- ExtremeAnalytics Custom Fingerprints
- Delete Custom Fingerprints
- Custom Fingerprint Examples
- Create Custom Fingerprints Based on Flow
- Create Custom Fingerprints Based on Destination Address
- Create Custom Fingerprints Based on Application or Application Group
- ExtremeAnalytics Packet Captures
- ExtremeAnalytics Configuration Overview
- Virtual Sensors
- ExtremeAnalytics Engine Advanced Configuration
- Flow Collection Type
- Collection Privacy Levels
- Client Aggregation
- Slow Client Data
- Max End-Systems in Hourly Details
- Sensor Log Levels
- Store Application Site Data
- ExtremeControl Integration
- Flow Sources/Application Telemetry Sources
- Web Credentials
- Configuration Properties
- Sensor Modules
- Auditing
- Network Settings
- ExtremeAnalytics Reports
- ExtremeAnalytics Report Descriptions
- Report Descriptions
- Analytics Events
- Bandwidth for a Client Over Time
- Interface Top Applications Treemap
- Sites Using the Most Bandwidth
- Most Popular Applications
- Most Used Applications for a Client
- Most Used Applications for a User Name
- Network Activity by Site
- Network Activity by Client
- Network Activity by Application
- Slowest Applications by Site
- Top Applications Group Radar
- Top Applications Radar
- Top Applications TreeMap
- Top Applications for Interface
- Top Applications for Server
- Top Clients by Interface
- Top Interfaces by Application
- Top N Applications
- Top N Clients
- Top N Servers
- Report Descriptions
- Add and Modify Fingerprints
- Add Fingerprints
- Enable or Disable Fingerprints
- Modify Fingerprints
- Update Fingerprints
- Custom Fingerprint Examples
- How to Deploy ExtremeAnalytics in an MSP or MSSP Environment
- ExtremeAnalytics Virtual Sensor Configuration in Extreme Management Center
- Stream Flow Data from ExtremeAnalytics into Splunk
- Stream Flow Data from ExtremeAnalytics into Elastic Stack

Reports
61 of 218
number. For example, a botnet command and control node may be a legitimate
webserver, which is not suspicious. However, if there are flows certain botnets are
known to use specific ports on a node, these communications cause the IPaddress
to be flagged in this classification.
l DShield Top Attackers — The DShield project is a distributed security analysis effort
that collects logs, IDS/IPS events, and other data from volunteers around the
Internet. This data is analyzed by DShield and a list of the top set of IP addresses that
appear to be attacking other systems worldwide is provided by DShield. When
application flows appear within ExtremeAnalytics that match any of the IP addresses
from the DShield top attackers list, it is likely systems in the local network are being
actively attacked.
l Tor Exit Node, Relay or Router — This reputation feed provides a listing of known
Tor exit nodes, relays, and routers. Tor is a service that provides IP anonymity. It
functions as a distributed set of systems on the Internet and builds sets of "virtual
circuits" through this set of systems on behalf of users that do not want to reveal
their local IP address to destination servers. Typically, Tor is used to mask web
browsing communications, but other services can run over the Tor network.
Matches against this reputation feed indicate Tor usage on the local network.
NOTE: IP addresses that match multiple classifications (e.g. an IP address is listed as both a
CiArmy Top Attacker and a DShield Top Attacker) are only classified in the first category
in which they match, not in additional categories.
Response Time Dashboard
The Response Time Dashboard displays the response time in milliseconds of
application data grouped by different criteria, selected from the drop-down list.
The data is displayed as a line graph, which is updated periodically.
Network Service Dashboard
The Network Service Dashboard displays the response time of network services
for the top five worst-performing sites as well as the overall average of all sites.
The data for each network service at a site is displayed as a bar and line graph,
which is updated periodically.