
User's Guide

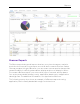
Table Of Contents
- ExtremeAnalytics® User GuideVersion 8.4
- Legal Notices
- Trademarks
- Contact
- Extreme Networks® Software License Agreement
- Table of Contents
- ExtremeAnalytics™ Help
- ExtremeAnalytics Licensing
- Configuring Enhanced Netflow for Extreme Analytics and Extreme Wireless Contr...
- How to Deploy ExtremeAnalytics in an MSP or MSSP Environment
- ExtremeAnalytics Tab Overview
- ExtremeAnalytics Dashboard Overview
- ExtremeAnalytics Insights Dashboard
- ExtremeAnalytics Tracked Applications Dashboard
- ExtremeAnalytics Browser Overview
- ExtremeAnalytics Application Flows
- ExtremeAnalytics Fingerprints Overview
- ExtremeAnalytics Custom Fingerprints
- Delete Custom Fingerprints
- Custom Fingerprint Examples
- Create Custom Fingerprints Based on Flow
- Create Custom Fingerprints Based on Destination Address
- Create Custom Fingerprints Based on Application or Application Group
- ExtremeAnalytics Packet Captures
- ExtremeAnalytics Configuration Overview
- Virtual Sensors
- ExtremeAnalytics Engine Advanced Configuration
- Flow Collection Type
- Collection Privacy Levels
- Client Aggregation
- Slow Client Data
- Max End-Systems in Hourly Details
- Sensor Log Levels
- Store Application Site Data
- ExtremeControl Integration
- Flow Sources/Application Telemetry Sources
- Web Credentials
- Configuration Properties
- Sensor Modules
- Auditing
- Network Settings
- ExtremeAnalytics Reports
- ExtremeAnalytics Report Descriptions
- Report Descriptions
- Analytics Events
- Bandwidth for a Client Over Time
- Interface Top Applications Treemap
- Sites Using the Most Bandwidth
- Most Popular Applications
- Most Used Applications for a Client
- Most Used Applications for a User Name
- Network Activity by Site
- Network Activity by Client
- Network Activity by Application
- Slowest Applications by Site
- Top Applications Group Radar
- Top Applications Radar
- Top Applications TreeMap
- Top Applications for Interface
- Top Applications for Server
- Top Clients by Interface
- Top Interfaces by Application
- Top N Applications
- Top N Clients
- Top N Servers
- Report Descriptions
- Add and Modify Fingerprints
- Add Fingerprints
- Enable or Disable Fingerprints
- Modify Fingerprints
- Update Fingerprints
- Custom Fingerprint Examples
- How to Deploy ExtremeAnalytics in an MSP or MSSP Environment
- ExtremeAnalytics Virtual Sensor Configuration in Extreme Management Center
- Stream Flow Data from ExtremeAnalytics into Splunk
- Stream Flow Data from ExtremeAnalytics into Elastic Stack

Reports
60 of 218
Healthcare Dashboard
The Healthcare Dashboard displays applications used in the healthcare
environment including patient care, medical applications, and HIPAA.
Venue Dashboard
The Venue Dashboard displays data grouped according to sports, social media,
news and weather applications, as well as software update applications.
IP Reputation Dashboard
This report displays potential threat activity on your network from IPaddresses
known to be suspicious. IP addresses can be flagged as suspicious for a variety
of reasons, including forced IPanonymity through the use of a Tor exit node,
being listed as a threat by the Emerging Threats project, or classified as
suspicious by internet users. Additionally, each IPaddress classification has its
own recommended course of action, listed below.
l CiArmy Top Attackers — The CiArmy reputation feed is a set of IP addresses tied to
malicious activity defined by a collaborative network security effort backed by the
Emerging Threats project. Any IP communications to addresses in this list from the
local network are suspicious and may indicate that the local IP is involved in various
activities such as command and control communications with the remote host. IP
addresses classified as CiArmy Top Attackers require further investigation.
l Compromised Hosts Connecting Into the Network — IPaddresses that match this
classification are on a list of IP addresses maintained by the Emerging Threats
project. This list consists of a set of IP addresses that appear to have been
compromised by malware, individual actors, worms, botnets, or other means. When
ExtremeAnalytics detects application flows that match an IP from the Compromised
list, this is a likely indicator that systems in the local network are either under attack
or have already been compromised (since the communications may be command
and control directives emanating from the compromised host).
l Connections to Bad Hosts — IP addresses classified as Connections to Bad Hosts are
known to function as command and control nodes for various botnets around the
Internet. Any flows to or from such IP addresses have a high probability of being
associated with botnet command and control traffic.
l Connections to Bad Hosts Based on Port — IP addresses flagged in this classification
are known to function as command and control nodes for botnets based on the port