
User's Guide

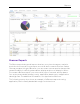
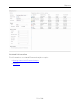
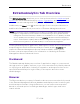
Table Of Contents
- ExtremeAnalytics® User GuideVersion 8.4
- Legal Notices
- Trademarks
- Contact
- Extreme Networks® Software License Agreement
- Table of Contents
- ExtremeAnalytics™ Help
- ExtremeAnalytics Licensing
- Configuring Enhanced Netflow for Extreme Analytics and Extreme Wireless Contr...
- How to Deploy ExtremeAnalytics in an MSP or MSSP Environment
- ExtremeAnalytics Tab Overview
- ExtremeAnalytics Dashboard Overview
- ExtremeAnalytics Insights Dashboard
- ExtremeAnalytics Tracked Applications Dashboard
- ExtremeAnalytics Browser Overview
- ExtremeAnalytics Application Flows
- ExtremeAnalytics Fingerprints Overview
- ExtremeAnalytics Custom Fingerprints
- Delete Custom Fingerprints
- Custom Fingerprint Examples
- Create Custom Fingerprints Based on Flow
- Create Custom Fingerprints Based on Destination Address
- Create Custom Fingerprints Based on Application or Application Group
- ExtremeAnalytics Packet Captures
- ExtremeAnalytics Configuration Overview
- Virtual Sensors
- ExtremeAnalytics Engine Advanced Configuration
- Flow Collection Type
- Collection Privacy Levels
- Client Aggregation
- Slow Client Data
- Max End-Systems in Hourly Details
- Sensor Log Levels
- Store Application Site Data
- ExtremeControl Integration
- Flow Sources/Application Telemetry Sources
- Web Credentials
- Configuration Properties
- Sensor Modules
- Auditing
- Network Settings
- ExtremeAnalytics Reports
- ExtremeAnalytics Report Descriptions
- Report Descriptions
- Analytics Events
- Bandwidth for a Client Over Time
- Interface Top Applications Treemap
- Sites Using the Most Bandwidth
- Most Popular Applications
- Most Used Applications for a Client
- Most Used Applications for a User Name
- Network Activity by Site
- Network Activity by Client
- Network Activity by Application
- Slowest Applications by Site
- Top Applications Group Radar
- Top Applications Radar
- Top Applications TreeMap
- Top Applications for Interface
- Top Applications for Server
- Top Clients by Interface
- Top Interfaces by Application
- Top N Applications
- Top N Clients
- Top N Servers
- Report Descriptions
- Add and Modify Fingerprints
- Add Fingerprints
- Enable or Disable Fingerprints
- Modify Fingerprints
- Update Fingerprints
- Custom Fingerprint Examples
- How to Deploy ExtremeAnalytics in an MSP or MSSP Environment
- ExtremeAnalytics Virtual Sensor Configuration in Extreme Management Center
- Stream Flow Data from ExtremeAnalytics into Splunk
- Stream Flow Data from ExtremeAnalytics into Elastic Stack

Dashboard
55 of 218
ExtremeAnalytics Tab Overview
The ExtremeAnalytics tab allows you to view and customize its dashboard and
browser, as well as ExtremeAnalytics reports, fingerprints, and application flow
data. You can also manage and configure your ExtremeAnalytics engines.
Additionally, the Menu icon ( ) at the top right of the screen provides links to
additional information about your version of Extreme Management Center.
NOTE: ExtremeAnalytics reports and application flow data is not available unless an ExtremeAnalytics
engine is configured and you are a member of an authorization group assigned the Extreme
Management Center ExtremeAnalytics Read Access or Read/Write Access capability. The Read
Access capability allows the ability to access the Analytics tab and view the ExtremeAnalytics
reports. The Read/Write capability adds the ability to configure ExtremeAnalytics engines and
NetFlow Collecting devices. It also adds the ability to create and modify fingerprints.
Viewing ExtremeAnalytics application data requires certain access requirements
and prerequisites. Both the ExtremeAnalytics feature and the Analytics tab
require the Extreme Management Center Advanced (NMS-ADV) license.
Contact your sales representative for information on obtaining an Extreme
Management Center Advanced license.
Dashboard
The Dashboard tab displays an overview of application usage on your network
through a series of graphs. It allows you to view network activity statistics based
on client/server, application, industry, IP reputation, and response time for the
specified ExtremeAnalytics engine. Many of the reports are links to more
detailed pages.
Browser
The Browser tab lets you query information about recent network activity stored
in the Extreme Management Center database and display results in various grid
and chart report formats. Using the Browser, you can create custom queries
based on selected options including a data target, statistic type, and other
search criteria.