
User's Guide

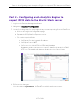
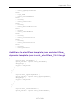
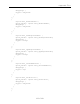
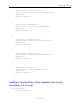
Table Of Contents
- ExtremeAnalytics® User GuideVersion 8.4
- Legal Notices
- Trademarks
- Contact
- Extreme Networks® Software License Agreement
- Table of Contents
- ExtremeAnalytics™ Help
- ExtremeAnalytics Licensing
- Configuring Enhanced Netflow for Extreme Analytics and Extreme Wireless Contr...
- How to Deploy ExtremeAnalytics in an MSP or MSSP Environment
- ExtremeAnalytics Tab Overview
- ExtremeAnalytics Dashboard Overview
- ExtremeAnalytics Insights Dashboard
- ExtremeAnalytics Tracked Applications Dashboard
- ExtremeAnalytics Browser Overview
- ExtremeAnalytics Application Flows
- ExtremeAnalytics Fingerprints Overview
- ExtremeAnalytics Custom Fingerprints
- Delete Custom Fingerprints
- Custom Fingerprint Examples
- Create Custom Fingerprints Based on Flow
- Create Custom Fingerprints Based on Destination Address
- Create Custom Fingerprints Based on Application or Application Group
- ExtremeAnalytics Packet Captures
- ExtremeAnalytics Configuration Overview
- Virtual Sensors
- ExtremeAnalytics Engine Advanced Configuration
- Flow Collection Type
- Collection Privacy Levels
- Client Aggregation
- Slow Client Data
- Max End-Systems in Hourly Details
- Sensor Log Levels
- Store Application Site Data
- ExtremeControl Integration
- Flow Sources/Application Telemetry Sources
- Web Credentials
- Configuration Properties
- Sensor Modules
- Auditing
- Network Settings
- ExtremeAnalytics Reports
- ExtremeAnalytics Report Descriptions
- Report Descriptions
- Analytics Events
- Bandwidth for a Client Over Time
- Interface Top Applications Treemap
- Sites Using the Most Bandwidth
- Most Popular Applications
- Most Used Applications for a Client
- Most Used Applications for a User Name
- Network Activity by Site
- Network Activity by Client
- Network Activity by Application
- Slowest Applications by Site
- Top Applications Group Radar
- Top Applications Radar
- Top Applications TreeMap
- Top Applications for Interface
- Top Applications for Server
- Top Clients by Interface
- Top Interfaces by Application
- Top N Applications
- Top N Clients
- Top N Servers
- Report Descriptions
- Add and Modify Fingerprints
- Add Fingerprints
- Enable or Disable Fingerprints
- Modify Fingerprints
- Update Fingerprints
- Custom Fingerprint Examples
- How to Deploy ExtremeAnalytics in an MSP or MSSP Environment
- ExtremeAnalytics Virtual Sensor Configuration in Extreme Management Center
- Stream Flow Data from ExtremeAnalytics into Splunk
- Stream Flow Data from ExtremeAnalytics into Elastic Stack

Part 1 – Installing and Configuring ElastiFlow and Elastic Stack
212 of 218
sudo mv 20_filter_40_sflow.logstash.conf 20_filter_40_
sflow.logstash.conf.disabled;
8. To prevent packet drops:
sudo cp -arv /usr/local/src/elastiflow-3.4.2/sysctl.d/87-
elastiflow.conf /etc/sysctl.d/.
To apply sysctl changes without restart:
sudo sysctl --system
9. Set up Kibana index patterns.
a. Download
https://github.com/robcowart/elastiflow/archive/v3.4.2.tar.gz to the
computer that you will use to view ElastiFlow.
b. Extract the files to a temporary directory.
c. In the web browser, go to http://YOUR_KIBANA_SERVER_IP:5601.
d. In the Kibana UI, select Management on the left side of the screen and then Saved Objects.
e. Click Import.
f. Select elastiflow-3.4.2\kibana\elastiflow.kibana.6.7.x.json.
g. Click Import.
10. Start Logstash:
a.
sudo /usr/share/logstash/bin/system-install
sudo systemctl daemon-reload
sudo systemctl start logstash
b. Run sudo tail -f /var/log/logstash/logstash-plain.log to see
messages from Logstash.
It is normal to see info messages such as the following in the log:
[INFO ][logstash.config.source.local.configpathloader] No
config files found in path
{:path=>"/etc/logstash/conf.d/*.conf"}
Depending on your system, it can take a few minutes for Logstash to start
up. When it starts, you should see a message that says: Successfully
started Logstash API endpoint.
11. Go to
https://github.com/robcowart/elastiflow/blob/master/INSTALL.md
and perform “Recommended Kibana Advanced Settings.”