
User's Guide
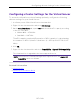

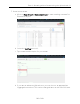
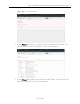
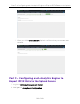
Table Of Contents
- ExtremeAnalytics® User GuideVersion 8.4
- Legal Notices
- Trademarks
- Contact
- Extreme Networks® Software License Agreement
- Table of Contents
- ExtremeAnalytics™ Help
- ExtremeAnalytics Licensing
- Configuring Enhanced Netflow for Extreme Analytics and Extreme Wireless Contr...
- How to Deploy ExtremeAnalytics in an MSP or MSSP Environment
- ExtremeAnalytics Tab Overview
- ExtremeAnalytics Dashboard Overview
- ExtremeAnalytics Insights Dashboard
- ExtremeAnalytics Tracked Applications Dashboard
- ExtremeAnalytics Browser Overview
- ExtremeAnalytics Application Flows
- ExtremeAnalytics Fingerprints Overview
- ExtremeAnalytics Custom Fingerprints
- Delete Custom Fingerprints
- Custom Fingerprint Examples
- Create Custom Fingerprints Based on Flow
- Create Custom Fingerprints Based on Destination Address
- Create Custom Fingerprints Based on Application or Application Group
- ExtremeAnalytics Packet Captures
- ExtremeAnalytics Configuration Overview
- Virtual Sensors
- ExtremeAnalytics Engine Advanced Configuration
- Flow Collection Type
- Collection Privacy Levels
- Client Aggregation
- Slow Client Data
- Max End-Systems in Hourly Details
- Sensor Log Levels
- Store Application Site Data
- ExtremeControl Integration
- Flow Sources/Application Telemetry Sources
- Web Credentials
- Configuration Properties
- Sensor Modules
- Auditing
- Network Settings
- ExtremeAnalytics Reports
- ExtremeAnalytics Report Descriptions
- Report Descriptions
- Analytics Events
- Bandwidth for a Client Over Time
- Interface Top Applications Treemap
- Sites Using the Most Bandwidth
- Most Popular Applications
- Most Used Applications for a Client
- Most Used Applications for a User Name
- Network Activity by Site
- Network Activity by Client
- Network Activity by Application
- Slowest Applications by Site
- Top Applications Group Radar
- Top Applications Radar
- Top Applications TreeMap
- Top Applications for Interface
- Top Applications for Server
- Top Clients by Interface
- Top Interfaces by Application
- Top N Applications
- Top N Clients
- Top N Servers
- Report Descriptions
- Add and Modify Fingerprints
- Add Fingerprints
- Enable or Disable Fingerprints
- Modify Fingerprints
- Update Fingerprints
- Custom Fingerprint Examples
- How to Deploy ExtremeAnalytics in an MSP or MSSP Environment
- ExtremeAnalytics Virtual Sensor Configuration in Extreme Management Center
- Stream Flow Data from ExtremeAnalytics into Splunk
- Stream Flow Data from ExtremeAnalytics into Elastic Stack

Adding the Virtual Sensor in ExtremeAnalytics
192 of 218
NOTE: If you enter an IP address included in a range defined in a site, the DNS Server and NTP
Server are automatically populated from that site, if defined.
13. Enter the Root Password for the Virtual Sensor.
14. Enter the Domain name (for example, extremenetworks.com).
15. Enter the DNS Server IP address and NTP Server IP address, if applicable.
16. Click Install.
NOTE: The installation may take several minutes. The Operations panel shows the progress of
the installation. It is normal for the progress to pause at 89 or 90 percent for a short
amount of time. During this time, the OVA is deployed and Extreme Management Center
is waiting for the new Virtual Sensor to be discovered via ZTP+. If Extreme Management
Center is not configured to on-board ZTP+ devices automatically, you need to access to
the Network > Discovered tab, and configure the new Virtual Sensor for Extreme
Management Center.
The Virtual Sensor is installed and displays in the Virtual Sensors table at the top
of the Analytics > Configuration > Virtual Sensors tab.
NOTE: If the installation process takes longer than five minutes, the Operation panel in Extreme
Management Center may incorrectly indicate the installation failed. If the Operations panel
indicates a failure, open the Network > Discovered tab and look for the Virtual Sensor. Continue
to add the Virtual Sensor via this tab. If the Virtual Sensor is NOT listed on the Discovered tab,
the cause may be one of the following:
l Extreme Management Center is not communicating with the management
interface of the Virtual Sensor.
l The Virtual Sensor is configured with the
Use DHCP option selected (step 11),
but the DHCP process did not complete successfully.
Open the Analytics > Application Flows tab to ensure the Virtual Sensor is
collecting flow data. Any fragmented packets the Virtual Sensor receives out of
order are re-ordered for processing and then forwarded in the correct order.
Once flows are collected by the Virtual Sensor, you can create packet captures
for those flows.
NOTES: If the Virtual Sensor receives traffic as it is initializing, packet drops (reported as mbuf
allocation failure) may be observed.